Featured Paper: GAISE 2024 Proposal: Three Introductory Courses
- 2024 Aug:
-
Statistical Literacy: Ratio-Based Grammar Research.
Schield: Proceedings of the Section on Statistics and Data Science Education. Aug 6, 2024 - 2024 Aug:
-
Causal Inference and Statistical Literacy: Handout.
Schield: Joint Statistical Meeting, Birds of a Feather Informal Gathering. Aug 7, 2024 - 2024 Jul:
-
Using English to Help Students Understand Quantitative ideas.
Schield: Journal of the Assembly for the Teaching of English Gramma . July 1, 2024 - 2024 Jun:
-
GAISE 2024 Proposal: Three Introductory Courses.
Slides
Schield: Electronic Conference on Teaching Statistics (ECOTS). June 11, 2024 - 2024 Apr:
-
Statistical Literacy: A New Course. (Paper).
Video
15 minutes April 30, 2024
Schield: ISLP International Day Of Statistical Literacy. (Closing keynote) - 2024 Apr:
-
Statistical Literacy for General Education.
Schield: AAC&U General Education Meeting: Innovation Track. Providence, RI April 12 - 2023 Nov:
- GAISE 2016: Analysis and Recommendations. Schield: Technical Report. Nov 5, 2023
- 2023 Jun:
-
Statistical Literacy: Humanistic Education for the Future.
Schield: New Directions in the Humanities (NDIH). June 22, 2023 - 2023 Jun:
- Teaching Confounding: Handout and Survey. USCOTS Two pages. June 2, 2023.
- 2022 Dec:
- Seven Questions for Policymakers. Schield IASE webinar video 10 minutes Dec 6, 2022.
- 2022 Oct:
- NNN Annual Meeting Univ. New Mexico Albuquerque. Fri-Sun This week! Oct 21-23.
-
Focus on Statistical Literacy. Keynote by Larry Lesser. Talks by teachers & students.
Math 1300 is arguably one of the very few courses that is GAISE 2016 (multivariate) compliant.
Available in-person or online. Schedule and registration on the NNN website: www.NNN-US.org - Statistical Literacy UNM Math 1300: First Year Results Schield ASA JSM Slides
- 2022-23 NNN Meeting: Conference program UNM Albuquerque NM. In person and online
- Hurricane Ian: NHC Projection Cone Advisories. Schield Sept 23-29, 2022. Slides
- 2022 Sep:
- Statistical Literacy USA. ISLP 2022 Q3 Newsletter. By Schield.
- 2020 Poverty Data by Race and Family Structure Since 1966. Schield Slides
- Cornfield's 1957 use of causal grammar. Schield Research paper.
- 2022 Aug:
- Association vs. Causation; Disparity vs. Discrimination. M. Schield 9/11/2022 ICOTS Rosario Argentina. Online. Slides
- Statistical literacy Goes Beyond Quantitative Literacy. M. Schield Mathfest slides Proposal
- Dictionary Definitions of Bias (noun). M. Schield
- Othmar Winkler, RIP. Wilhelm Winkler by Alexander Perwinkler. 1984.
- 2022 Jun:
- Statistical Literacy: Seven Simple Questions for Policymakers. M. Schield. SJIAOS Invited, peer-reviewed 6/12/2022
- Statistical Literacy: Critical Thinking about Confounding. Conference on Critical Thinking. Slides Announcement Video (25 minute)
- Statistical Literacy: Critical Thinking about Statistics. Conference on Critical Thinking. Slides Announcement Video (25 minute)
- Statistics and Quantitative Literacy. Richard L. Schaeffer. 2004. Quantitative Literacy: Why Numeracy Matters.
- References to Confounding in De Veaux Intro Stats Introductory Statistics 5th ed. by De Veaux, Velleman and Bock. 2018.
- European Statistics Schools Competition Winners. Eurostat.
- Statistical Literacy Proposal by M. Schield Augsburg 1997.
- 2022 May:
- Introducing Statistical Literacy: A Lesson Plan. Milo Schield ECOTS Activity 5/24/2022
- Teaching Statistical Literacy: Choice of Topics. Milo Schield. 5/26/2022 ECOTS Birds of a Feather (One-page handout)
- ASA JSM Talks related to Statistical Literacy. M. Schield 2022
- Statistical Survey Project Requirements using Minitab. M. Schield 1992.
- 2022 Mar:
- What Every Educator ... should know about Civic Statistics by Iddo Gal IASE workshop 3/14/2022
- Math is music; Statistics is literature. by Richard De Veaux and Paul Velleman 2008
- Statistical Literacy in Northeast China by Robert Giebitz ICOTS9 (2014) Poster
- The Immortal Sowell by Charles Murray in the Claremont Review Winter 2021-22
- Using Minitab for Exploratory Data Analysis by Milo Schield 1995 Student handout
- 2022 Feb:
- NNN Keynote1: Jane Miller, Beyond Statistical Significance 3/4/21.
-
NNN Keynote2: Susan Ganter, Q/L: Promoting Institutional Transformation
3/5/2021
30+ papers, Register for this online conference at www.NNN-US.org. - 2022 Feb:
- Statistical Literacy is Essential .... by Anna Bargagliotti and Hollylynne S. Lee. 2/22/2022.
- 2022 Feb:
- Statistical Reasoning Table of Contents 5th edition (2018) by Bennett, Briggs and Triola
- 2022 Jan:
- UNM offers confounder-based statistical literacy course. ISLP 12/2021 Textbook TOC
- The Immortal Sowell by Charles Murray in the Claremont Review Winter 2021-22
- Schield 2021 Lifetime Statistical Achievements. Milo Schield, 12/2021
- 2021 Dec:
- NNN Meeting March 4-6, 2022 Hybrid: U. South Florida, Tampa. Call for Papers.
- 2021 Oct:
- Offering Statistical Literacy Handout. Schield Research paper Oct, 2021
- 2021 Aug:
- Simpson's Paradox and Covid Deaths. Schield 8/12/2021 ASA JSM Birds of a Feather Slides 1 page handout 8/11
- 2021 Aug:
- Statistical Literacy Approved for General Education at U. New Mexico. Schield 8/11 JSM Full Slides Video; Speed Slides Video
- 2021 Aug:
- Statistical Literacy: The Diabolical Denominator. Schield 8/4/2021 MathFest Slides Video
- 2021 Aug:
- A Simple Graphic Method to Assess Correlation Othmar Winkler 2021 Biometrics and Biostatistics International Journal
- 2021 Jun:
- Teaching Confounding by Milo Schield. 6/26/2021 USCOTS Two-hour invited workshop. Slides
- 2021 Jun:
- Statistical Literacy for Policy Makers Schield 7/16/2021 Slides ISI ISLP: Stat & Data Lit for Policy Makers
- 2021 Jun:
- Ambiguity of Phi in Excel by Milo Schield.
- 2021 May:
- The War on Statistical Significance by Donald Macnaughton. A must-read for statistical educators.
- 2021 May:
- 125 statistical educators sign up for Schield's USCOTS workshop: Teaching Confounding. Sat 26 June.
- 2021 May:
- Schield JSM (UNM offers new statistical literacy course). Speed session: Wed Aug 11 at 1:30 EDT.
- 2021 Apr:
- Schield Planned Presentations 2021 StatLit Picks USCOTS Schedule 2021
- 2021 Mar:
- Schield comments: Dashiell Young-Saver's Dangerous Denominators. New York Times
- Nate Bowling's Statistical Literacy is Too Important... in StatsMedic.
- 2021 Jan:
- NNN Meeting Feb 26-28 Announcement Schedule 28 papers. Online.
- Keynotes: Carl Bergstrom and Jevin West (Teaching "Calling Bullshit") and Jessica Utts (Confounding)
- 2020 Dec:
- Call for Research on English Grammar Used to Describe and Compare Ratios. Schield 12/03/2020
- 2020 Nov:
- NNN Call for Papers By Nov 30. National Numeracy Network Annual Meeting. Feb 25-27
- 2020 Nov:
- Covid19: Infections, Cases and Deaths (slides) by Milo Schield 11/21/2020
- 2020 Nov:
- NNN-MAA Numeracy Survey: Call for Participants. National Numeracy Network
- 2020 Aug:
- Statistical Literacy: Scanlan's Paradox. Schield 8/03 JSM Slides Audio
- 2020 Jul:
- 2020 Coronavirus Covid-19: An Explanatory Model. Slides Milo Schield 7/19/2020.
- 2020 May:
- Controlling for Context by Standardizing. Schield 5/20 ECOTS Slides Video (5 min)
- 2020 Mar:
- Covid19: An Analysis (slides) by Milo Schield 03/08
- 2019 Jul:
- The 9 Pitfalls of Data Science by Gary Smith and Jay Cordes. TOC.
- 2019 May:
- NNN 2019 Annual Meeting: Call for papers. Austin TX Oct 11-13 National Numeracy Network
- 2019 May:
- "Statistical Literacy: Evaluating Evidence from Observational Studies." Schield's USCOTS Workshop: May 14 1-4 pm
- 2019 May:
- Interpreting the CDF of Socio-Economic Data 1/2019. A Statistical Mystery Resolved 5/2019. Othmar Winkler
- 2019 Apr:
- Univ. New Mexico developing two new courses: Statistical Literacy and Statistics for Research. See ASA Connect April 4. Stat Ed section.
- 2019 Jan:
- Statistical Literacy: Evaluating Evidence from Observational Studies. Schield's USCOTS Workshop: May 14 1-4 pm
- 2018 Jul:
- Confounding and Cornfield: Back to the Future. By Milo Schield (2018) for ICOTS 10.
- “Cornfield's minimum effect size is one of the greatest contributions of statistics to human knowledge alongside the Central limit theorem and Fisher's use of random assignment to statistically control for pre-existing confounders.” “To change the future, we need to go back to when Jerome Cornfield argued that smoking caused cancer.” “Our unwillingness to talk about observational causation, confounding and strength of evidence is arguably the primary reason our students' see little value in the introductory statistics normally taught in Stat 101.” “We need to teach multivariate statistics, confounding and the Cornfield conditions so students will appreciate statistics.”
- 2018 Nov:
- IASE 2019 Satellite Conference Announcement. Kuala Lumpur
- 2018 Oct:
- ISI Objectives: “#4. To advocate and foster statistical literacy, the use of statistics and data in decision-making by governments, businesses and individuals.”
- 2018 Jul:
- Statistical Literacy and the Lognormal Distribution. by Milo Schield (2018) for ASA JSM.
- “There is no public data on the income share of the top 1% of households; those percentages are estimates. Those estimates vary from 5% to 40%. They are based on different data using different definitions and different models.”
- Schield selected as a Fellow by the American Statistical Association. Summary Certificate
- 2018 May:
-
The Book of Why: A New Science of Cause and Effect.
Judea Pearl.
Summary and TOC.
Index
“Judea Pearl's new book, The Book of Why, is a must read for anyone interested in philosophy, science, machine learning or statistics. The Book of Why is arguably the most important book on causal statistics since Cornfield debated Fisher on whether smoking caused lung cancer.” Schield (2018) - Six Books that Sharpened my BS Detector by Joseph Makansi.
- 2018 Apr:
- Seven Habits of Highly Numerate People by Doug Berdie. Minneapolis Star and Tribune.
- 2018 Mar:
- Gartner Advanced Analytics and Big Data Summit.
- Marc Isaacson and Milo Schield (Quant-Fluent) conduct a three-hour workshop on Data Literacy and Statistical Literacy
- Schield interview with Ryan Dunlap: See bottom of Video page.
- Quant-Fluent website opened. Marc Isaacson and Milo Schield (April)
- 2017 Jun:
- SERJ Special Issue: Statistical Literacy
- The future of Statistical Literacy is the future of statistics Editorial by guest editors Jim Ridgway and James Nicholson.
- “On an optimistic note, Milo Schield argues that the 2016 revision of the GAISE Guidelines marks a major step forward in promoting statistical literacy via its increased emphasis on evidence appropriate for decision making — such as paying attention to study design and multivariate data and associated concepts such as confounding.”
- “Conclusion: Statistical literacy is a pre-requisite for an informed democracy. Increasing statistical literacy is a key element in warding off the existential crisis we face. Revising current curricula in school and at university to ensure that there is an adequate focus on using evidence to make decisions in realistic contexts is an essential starting point. At least as important is for statistics educators to take a broader view of their task, and to engage directly with the illiteracies encountered in broadcast and social media — for example by direct critique, or by promoting statistical literacy directly. There is a need for disparate elements of the statistics community to come together; cultivating statistical literacy across the whole of society should be a goal that brings like-minded people together with a common cause.”
Invited Editorials:
- Statistical Literacy in the Data Science Workplace by Robert Grant
- Data Literacy Is Statistical Literacy by Robert Gould
- Interactive Visualisations and Statistical Literacy by Sinclair Sutherland and Jim Ridgway
- Statistical Literacy as the Earth Moves by Chris J. Wild
- Statistical Literacy in Data Revolution Era: Building Blocks and Instructional Dilemmas by Theodosia Prodromou and Tim Dunne
- Statistical Literacy for Active Citizenship: A Call for Data Science Education by Joachim Engel
-
GAISE 2016 Promotes Statistical Literacy
by Milo Schield
“Conclusion: By introducing multivariate thinking and, more importantly, confounding, the GAISE revision committee has accepted — and greatly advanced — statistical literacy in the process. The revised guideline (GAISE, 2016) is the most important institutional paper advancing statistical literacy to date. Including multivariate thinking and confounding in introductory statistics courses and textbooks will be the biggest change in statistical education in decades. These are exciting times for statistical literacy and for statistics education.” - Against Inferential Statistics: How and Why Current Statistics Teaching Gets It Wrong by Patrick White and Stephen Gorard
- A Response to White and Gorard: Against Inferential Statistics by James Nicholson and Jim Ridgway
- Still against Inferential Statistics: Rejoinder to Nicholson and Ridgway by Stephen Gorard and Patrick White
Research Papers:
- From the Classroom to the Workplace: How Social Science Students Are Learning to do Data Analysis for Real by Jackie Carter, Mark Brown, and Kathryn Simpson
- Telling Stories, Landing Planes and Getting Them Moving — A Holistic Approach to Developing Students' Statistical Literacy by Julie Scott Jones and John E. Goldring
- Opening Real Science: Evaluation of an Online Module on Statistical Litercy for Pre-Service Primary Teachers by Ayse Aysin Bombaci Bilgin, Elizabeth Date-Huxtable, Carmel Coady, Vincent Geiger, Michael Cavanagh, Joanne Mulligan, and Peter Petocz
- Developing Statistical Literacy in the Final School Year by Stephanie Budgett and Drusilla Rose
- Interpretation of Statistical Data: The Importance of Affective Expressions by Tamires Queiroz, Carlos Monteiro, Liliane Carvalho, and Karen François
- The Development of Statistical Literacy at School by Rosemary Callingham and Jane M. Watson
- Key Success Factors for Statistical Literacy Poster Competitions by Steve MacFeely, Pedro Campos, and Reija Helenius.
- Statistical Literacy in Public Debate — Examples from the UK 2015 General Election by Phoebe Arnold
Regular Papers:
- Is the P-value Really Dead? Assessing Inference Learning Outcomes for Social Science Students in an Introductory Statistics Course by Sharon Lane-Getaz
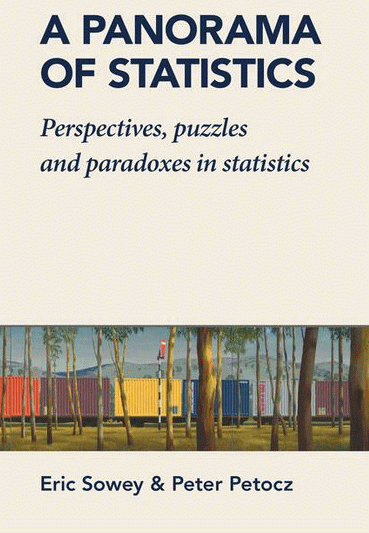
2017: June Panorama of Statistics: Perspectives, puzzles and paradoxes in statistics by Eric Sowey & Peter Petocz.
“The authors guide readers, who already know something of statistics, to see the richness of the discipline and to let them discover its fascinations. Among the chapters you can find aspects of statistics (e.g. statistical literacy, intellectual history, and epistemology) that are outside the conventional instructional mainstream and beyond the scope of most textbooks. This is a book which can engage curious students, teachers, and consumers of statistics, as well as practitioners of statistics and of statistics-using disciplines.”
Table of Contents: Part I. Introduction. 1) Why is statistics such a fascinating subject? 2) How statistics differs from Mathematics 3) Statistical literacy - essential in the 21st century! 4) Statistical inquiry on the web. Part II: Statistical description 5) Trustworthy statistics are accurate, meaningful and relevant 6) Let hear it for the standard deviation! 7) Index numbers - time travel for averages 8) The beguiling ways of bad statistics I 9) The beguiling ways of bad statistics II Part III: Preliminaries to inference 10) Puzzles and paradoxes in probability 11) Some paradoxes of randomness 12) Hidden risks for gamblers 13) Models in statistics 14) The normal distribution: history, computation and curiosities Part IV Statistical inference 15) The pillars of applied statistics I - estimation 16) The pillars of applied statistics II - hypothesis testing 17) 'Data snooping' and the significance level in multiple testing 18) Francis Galton and the birth of regression 19) Experimental design - piercing the veil of random variation 20) In praise of Bayes Part V: Some statistical byways 21) Quality in statistics 22) History of ideas: statistical personalities and the personalities of statisticians 23) Statistical eponymy 24) Statistical 'laws' 25) Statistical artifacts Part VI: Answers to chapter questions
2017 May 16: Atlantic. Protecting the Public Commons by Alexander B. Howard May. “A core component of a high school education should include teaching people how to judge risk, statistical literacy, and how to exercise our rights to access public information.”
2017 May 12: New ISI Objective: To advocate and foster statistical literacy, the use of statistics and data in decision making by governments, businesses and individuals. ISI 2017 Update of Mission and Objectives. 2016 Mission and Objectives.
2017 April 29: Schield invited to talk on Statistical Literacy in Toronto at the
Field Institute Math-Ed forum
Schedule
Statistical Literacy: What is it... Who needs it... What is stopping it...
Slides
Audio
PPTX
2016 July: Offering STAT 102: Social Statistics for Decision Makers. Schield IASE Roundtable in Berlin.
2015: Introduction to Statistical Investigations by Tintle, Chance, Cobb, Rossman, Roy, Swanson & VanderStoep (2015). Wiley Description & TOC 2014pb
The Math Myth and Other STEM Delusions Book by Andrew Hacker. The Wrong Way to Teach Math 2/2016. NY Times Is Algebra Necessary? 7/2012 NY Times. Reviews: Goldstein “Hecker: Down with Algebra II”. 2012 Rebuttals: Mehta, Devlin. 2016 Rebuttals: Devlin
Aug 4. “Willful Ignorance” by Herb Weisberg is now
available!! [Editor: This book is my #1 pick for 2014.]
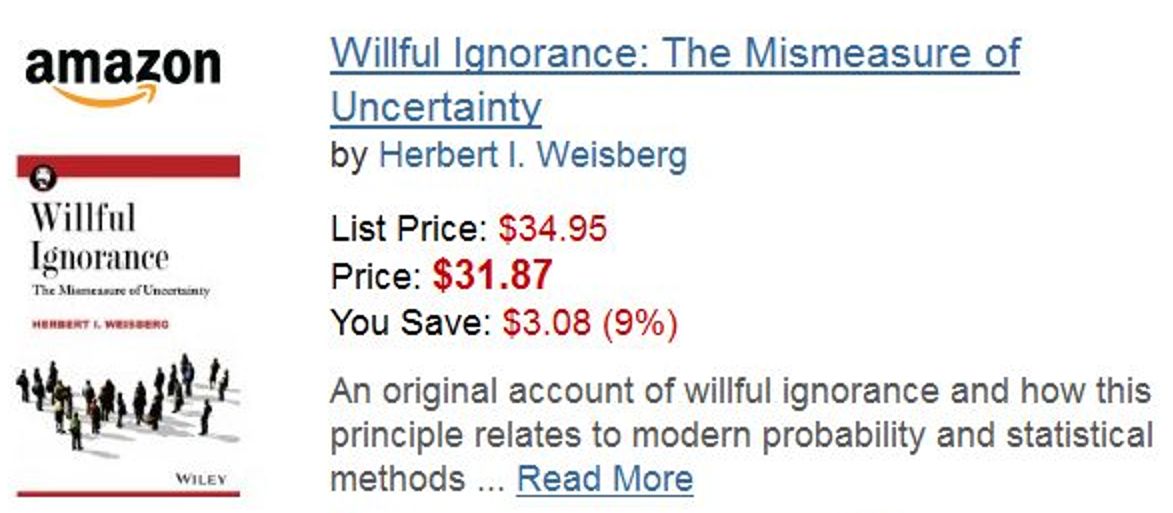 Weisberg's grasp of statistical history
is comprehensive without being over-whelming. But this is more than
just a history book on statistics. Weisberg has a point to make --
that statisticians have mis-measured uncertainty! And this mis-measurement
involves “willful ignorance”!!! These are fighting words for
statisticians who consider the proper measurement of uncertainty to be their
primary task. For more details on Herbert Weisberg, visit
his page. If you buy one
statistics book this year, buy this one!
Amazon US
Two Big Ideas for Teaching Big Data: Coincidence and Confounding by Milo Schield. ECOTS invited paper downloaded 4,200 times in the seven months it has been posted in 2014. See also Schield slides presented at Big Data panel.
“I hope that...statistical literacy will...rise to the top of your advocacy list.” Ruth Carver, ASA 2012 Presidential Address
29% of US Freshman took stats in high school (15% took AP Stats), so 14% took non-AP Stats. 2012 Am. Freshman
Spurious Correlations (More than 9,000 computer-generated as of 5/2014): For example: Number of people who died by becoming tangled in their bed sheets correlates with Total revenue generated by skiing facilities (US). [Great examples, but a high correlation coefficient between two times series does not imply statistical significance -- much less a causal connection. See Cross-correlation. Editor]
2014 10: Highest Monthly Downloads: October had 45,000 downloads from this site: the highest number in our ten-year history. Last year's monthly high was 26,000 in May. The biggest cause is the download of the PowerPoint demos to create various statistics and models using Excel: over 67,000 YTD. The “Create-Lognormal-Excel2013” demo has had 36,000 downloads so far this year.
2014 11: Highest Monthly Index Views @ StatLit.org: November had 6,200 index views -- 33% more than last year's monthly high.
DEFINITIONS
“Statistical literacy is the ability to read and interpret summary statistics in the everyday media: in graphs, tables, statements, surveys and studies. Statistical literacy is needed by data consumers — students in non-quantitative majors: majors with no quantitative requirement such as political science, history, English, primary education, communications, music, art and philosophy. About 40% of all US college students graduating in 2003 had non-quantitative majors.” By Milo Schield in “Assessing Statistical Literacy: Take CARE” Ch 11 in Assessment Methods in Statistical Education, pp. 133-152. Wiley 2010 Schield excerpts
Short introduction to Statistical Literacy. For more on confounding, see Standardizing.
UK Parliament Briefing paper on Statistical Literacy
Statistical literacy: “the ability to read and interpret statistics, and think critically about arguments that use statistics as evidence” United Nations Development Dictionary (move slider to “s”) [link broken/missing in 2012]
Statistical literacy: “understanding the basic language of statistics (e.g., knowing what statistical terms and symbols mean and being able to read statistical graphs), and understanding some fundamental ideas of statistics.” GAISE College Report
NEWS
Newest StatLit.org web pages:
- Lynn Steen (2017). Eminent mathematician (-2015)
- Jerome Cornfield (2015). Eminent statistician (1912-1979)
- Herbert Weisberg (2014): Author of Willful Ignorance: Measurement of Uncertainty
- Wayne Winston (2014): Author of Statistically Thinking
- Judea Pearl (2014): Author of Causality. See Causality in Stat-Ed.
- Kaiser Fung (2013): Author of Numbersense: Use Big Data ...
- Conrad Carlsberg (2013): Author of Decision Analytics: Excel
- David Moore: Bestselling author of statistics textbooks
3 Most Important Statistical Literacy Articles Since 2002
If you read just one article, read Appendix B of the 2016 update to the ASA GAISE recommendations. This paper argues that introductory statistics courses should include multivariate thinking (and confounding). See also footnote 40 in ASA (2014). Curriculum Guidelines for Undergraduate Programs in Statistical Science. "Issues of confounding and causal inference are central to the discipline of statistics."
The second-most important paper introduces confounding as 'one of the two major themes in statistical analysis'. See. Challenging the state of the art in post-introductory statistics by Tintle, Chance, Cobb, Rossman, Roy, Swanson and VanderStoep (2013).
The third by the same authors is Introduction to Statistical Investigations (2016) where confounding is introduced in chapter 4 on causation.
“By introducing confounding, these three papers are arguably the most important non-Schield papers in statistical education since 2002 when Howard Wainer publicized 'The BK-Plot: Making Simpsons' Paradox Clear to the Masses'. Together they mark a new beginning of statistics education for the 21st century.” Milo Schield, StatLit Editor
ARTICLES/SLIDES POSTED in 2015
2015 Articles Posted to StatLit.org (by Month)
| 1 | Challenge Statistical Claims in Media, Martinez-Dawson ASA 2013 |
2015 Slides and Worksheets Hosted (by Month)
| 7 | 2013 MSMESB: MS Business Analytics program. Nargundkar | slides |
ARTICLES/SLIDES POSTED in 2014
2014 Articles Posted to StatLit.org (by Month)
2014 Slides and Worksheets Hosted (by Month)
| 11 | Business Analytics and Data Science. Schield DSI 2014 | slides |
| 10 | Statistical Literacy+Coincidence. Schield NNN1 Workshop 2014 | slides |
| 10 | Explore Log-Normal Incomes Schield NNN2 2014 | slides xls update |
| 10 | Creating Distributions Empirically. M. Schield. NNN3 Workshop | slides |
| 10 | Statistically-Significant Correlations. Milo Schield. NNN4 2014 | slides |
| 10 | Segmented Linear Regression. Schield. NNN5 Workshop 2014 | slides |
| 8 | Top 30 Learning Goals for Introductory Sociology. Persell 2010 | list |
| 8 | Social Science Reasoning & QL Learning Goals Caulfield+Persell'06 | list |
| 7 | 2013 MSMESB: Predictive Analytics course. Levine et al. | slides |
| 7 | 2013 MSMESB: Spreadsheet Analytics. James R. Evans. | slides |
| 7 | 2013 MSMESB: Implications of Big Data for Stat Ed. Berenson | slides |
| 7 | 2013 MSMESB: Big Data & Statistics Instruction. Berenson | slides |
| 7 | 2013 MSMESB: Big Data in Stat 101: Small changes. McKenzie | slides |
| 7 | 2013 MSMESB: Create Business Analytics class. Kirk Karawan. | slides |
| 7 | 2013 MSMESB: Getting Analytics into the curriculum. Karawan. | slides |
| 7 | 2013 MSMESB: Analytics and the Evolving Workforce. LaBarr. | slides |
| 7 | 2013 MSMESB: MS Business Analytics program. Nargundkar. | slides |
TOP DOWNLOADS: 2019 (Google Clicks: 2019)
Top 20 Downloads of Papers
| 1 | 5,160 | 2013-Knapp-To-pool-or-not-to-pool |
| 2 | 4,110 | 2018-Pearl-Book-of-Why-Summary-Reviews |
| 3 | 1,704 | 2018-Thirty-Best-Data-Science-Books |
| 4 | 1,533 | 2013-Kriska-ASA |
| 5 | 1,530 | 2016-Tintle-Intro-to-Statistical-Investigations-TOC |
| 6 | 1,492 | 2008MillerASA |
| 7 | 956 | 2009WinklerASA |
| 8 | 853 | 2010Schield-StatLit-Intro4p |
| 9 | 832 | 2016-Levitin-Field-Guide-to-Lies-TOC-Intro |
| 10 | 800 | 2012-Knapp-Learn-Statistics-through-Playing-Cards |
| 11 | 724 | 2016-Neath-ASA |
| 12 | 588 | 2011Lesser-JSM |
| 13 | 569 | 2019-Schield-Gender-Pay-Gap |
| 14 | 499 | 2014-Schield-RR-Statistical-Significance |
| 15 | 455 | 2010kempkissaneicots |
| 16 | 434 | 1994SchieldASA |
| 17 | 414 | 2013-Knapp-Likert-and-Visual-Analog-Scales |
| 18 | 383 | 2017-Schield-ASA |
| 19 | 379 | 2014-Schield-SS-Shortcut-Chi-Square |
| 20 | 364 | 1994schieldasa |
Next 20 Downloads of Papers
| 21 | 355 | 2008SchieldBurnhamASA |
| 22 | 348 | 2014-Molnar-ICOTS-Poster-Tasks |
| 23 | 305 | 2014-Utts-Seeing-Through-Statistics-4th-TOC |
| 24 | 275 | 2009SchieldRaymondASA |
| 25 | 272 | 2001-Steen-Mathematics-Educator-Singapore |
| 26 | 230 | 2004KlassASA |
| 27 | 227 | 2012Schield-ASA |
| 28 | 204 | 2016-Knapp-QRM |
| 29 | 186 | 2009BoltonStatisticalLiteracyGuideUK |
| 30 | 167 | 2014-Sigman-Teaching-Big-Data-DSI |
| 31 | 149 | 2013-Martinez-Dawson-ASA |
| 32 | 146 | 2015-Schield-ASA |
| 33 | 146 | 2012-Gorroochurn-xx-Simpsons-Paradox |
| 34 | 146 | 2013-knapp-likert-and-visual-analog-scales |
| 35 | 137 | 1927-AT-Rowe-Dwight-Moody-Soul-Winner-OCR |
| 36 | 119 | 2005MauchDissertation |
| 37 | 117 | 1957-Aitchison-Brown-Excerpts |
| 38 | 111 | 1993-Schield-Summary-1896-Carroll-Symbolic-Logic |
| 39 | 109 | 2016-Schield-Sum-Identical-LogNormals- |
| 40 | 109 | 2006SchieldASA |
TOP Schield Downloads
Top 20 Downloads of Schield Papers (Google clicks)
| 1 | 853 | 2010Schield-StatLit-Intro4p |
| 2 | 569 | 2019-Schield-Gender-Pay-Gap |
| 3 | 499 | 2014-Schield-RR-Statistical-Significance |
| 4 | 434 | 1994SchieldASA |
| 5 | 383 | 2017-Schield-ASA |
| 6 | 379 | 2014-Schield-SS-Shortcut-Chi-Square |
| 7 | 355 | 2008SchieldBurnhamASA |
| 8 | 275 | 2009SchieldRaymondASA |
| 9 | 227 | 2012Schield-ASA |
| 10 | 146 | 2015-Schield-ASA |
| 11 | 111 | 1993-Schield-Summary-1896-Carroll-Symbolic-Logic |
| 12 | 109 | 2016-Schield-Sum-Identical-LogNormals- |
| 13 | 109 | 2006SchieldASA |
| 14 | 63 | 2007SchieldMSS |
| 15 | 45 | 2018-Schield-ICOTS |
| 16 | 43 | 2011Schield-ASA-Chair |
| 17 | 37 | 2017-Schield-LogNorm-Loss-Freq-Sev-Dist-Demo |
| 18 | 33 | 2017-Schield-LogNorm-Median-Given-Mean+StdDev |
| 19 | 26 | 2016-Schield-IASE |
| 20 | 26 | 2018-Schield-ASA-Fellow-Nomination |
Top Web Pages in 2019
Top 20 Page Views of StatLit Web Pages (Google)
| 1 | 1,387 | Best |
| 2 | 728 | index |
| 3 | 351 | Blastland |
| 4 | 262 | Cornfield |
| 5 | 177 | Gigerenzer |
| 6 | 151 | Weisberg |
| 7 | 141 | QL3 |
| 8 | 124 | AdultNumeracy |
| 9 | 121 | Jrnl1 |
| 10 | 108 | Video1 |
| 11 | 107 | Pearl |
| 12 | 106 | Winston |
| 13 | 101 | Wainer |
| 14 | 85 | Bracey |
| 15 | 71 | Moore |
| 16 | 61 | Steen |
| 17 | 59 | Schield |
| 18 | 59 | Tools |
| 19 | 59 | Miller |
| 20 | 50 | Paulos |
MOST POPULAR STATLIT PAGES in 2017
| 76,209 | Index to StatLit.org website [This page] |
| 3,261 | Howard Wainer author page |
| 3,148 | Quantitative Literacy/Reasoning Textbooks as of 2015. Schield |
| 2,910 | Statistical Literacy Articles by Year posted to StatLit.org |
| 2,845 | StatLit News: 2009 News of the Year |
| 2,749 | StatLit News: 2013 News of the Year |
| 2,689 | Joel Best author page |
| 2,684 | Standardizing. Different techniques by Schield |
| 2,440 | StatLit News: 2012 News of the Year |
| 2,372 | StatLit News: 2011 News of the Year |
| 2,311 | StatLit News: 2010 News of the Year |
| 2,217 | StatLit Tools Excel-based tools for analyzing statistics |
| 2,153 | Gerald Bracey author page |
| 2,061 | StatLit News: 2008 News of the Year |
| 1,967 | Gerd Gigerenzer author page |
| 1,949 | Adult Numeracy page |
| 1,849 | StatLit News: 2014 News of the Year |
| 1,224 | StatLit News: 2007 News of the Year |
| 1,179 | Blastland author page |
| 1,110 | StatLit News: 2006 News of the Year |
| 1,087 | Milo Schield author page with related items |
Note: the leading number is the number of page reads for each page.
OTHER RECOMMENDED INTRO BOOKS
- Victor Cohn (1989), News and Numbers
- Darrell Huff (1954), How To Lie with Statistics
- Edward Tufte (1995), Visual Explanations
ACADEMIC TOPICS
RECOMMENDED ARTICLES
Intro Overview Articles
Web-accessible articles presenting a general background or overview.
Statistical Literacy:
- Enhancing Statistical Literacy: Enriching Our Society by Katherine Wallman, 1992 ASA Presidential Address
- Statistical Literacy for All by Anne Hawkins. 1997 ISI
- Toward a Statistically Literate Citizenry: What Statistics Everyone Should Know by Jerry Moreno, ICOTS-6 2002
- Statistical Literacy, Numeracy and the Future by Peter Holmes, talk at Augsburg College 31 March 2003
- Including Construction in Quantitative Literacy by Joel Best, 4/2007 Talk at Midwest Sociological Society, Chicago
- Birds -- Dead and Deadly: Why Quantitative Literacy needs to Address Social Construction by Joel Best 2008 Numeracy, V1,N1.
Quantitative Literacy:
- Quantitative Literacy: Why Numeracy Matters for Schools and Colleges by Lynn Steen, MAA Online
- Why Numbers Count: Foreword by Robert Orrill, 1998.
- Quantitative Literacy and Statistics by Richard Scheaffer, ASA President 2001 AmStat News Nov. 293
- Educating for Numeracy by Bernie Madison, 2002 AMS
- Pedagogical Challenges of Quantitative Literacy by Bernie Madison, President of NNN, 2006 ASA 6up
W. M. Keck Statistical Literacy Project
Fifteen articles involving the W. M. Keck Statistical Literacy Project:
- Stat 102: Social Statistics for Decision Makers, M Schield 2016. IASE Roundtable
- GAISE 2016 Promotes Statistical Literacy, Milo Schield SERJ 2017.
- Statistical Literacy and Liberal Education at Augsburg College, Milo Schield, 2004 AACU Peer Review.
- Teaching Statistical Literacy as Quantitative Rhetoric , John Schmit, ASA 2010 6up
- Presenting Confounding Graphically Using Standardization, Milo Schield, 2006 STATS magazine.
- Two Big Ideas for Teaching Big Data: Coincidence & Confounding, Schield 2014 ECOTS
- Statistical Literacy: A New Mission for Data Producers, Schield, 2011 Statistical Journal International Assoc Official Statistics
- Statistical Literacy: An Online Course at Capella University, Marc Isaacson 2005 ASA
- Confound those Speculative Statistics, Milo Schield 2009 ASA
- Statistical Literacy & Mathematical Thinking, Schield 2000 ICME9
- Association-Causation Problems in News Stories, Milo Schield 2010 ICOTS, Ljubljana
- Distinguishing Association from Causation in Media Headlines, Schield+Raymond 2009 ASA
- The Social Construction of Rankings, Milo Schield 2010 ASA
- Teaching the Social Construction of Statistics, Schield 2007 Midwest Sociological Society
- Statistical Literacy and Chance, Milo Schield 2005 ASA 6up 1up
STATISTICS GUIDES
- UNECE Making Data Meaningful: Part 1 2009
- UNECE Making Data Meaningful: Part 2 2009
- Short introduction to Statistical Literacy by M Schield.
- UK Parliament: Briefing Papers on Statistics for Policy Makers
-
Making Sense of Statistics
by Nigel Hawkes and Leonor Sierra.
Section 1: If a statistic is the answer, what was the question?
Section 2: Common pitfalls.
Section 3: How sure are we?
Section 4: Percentages and risk; knowing the absolute and relative changes.
2018 GENERAL INTEREST NEWS
- Judea Pearl publishes The Book of Why: The New Science of Cause and Effect. TOC Index [Editor: This is a must-read for every statistical educator.]
IMS 2019 PROFESSIONAL EVENTS Statistics
- 2020: May 19-21:
- ECOTS
-
- Mon:
- Workshop: Multivariable thinking across the curriculum by Chance et al.
- Tues:
- Poster: Exploring how students reason about correlation and causation by Evans et al.
- Wed:
- Poster: Controlling for Context using Standardization by Schield Slides Video (5 min)
- Thurs:
- 11:45 Building Q/L among Social Justice Oriented Students by Bettinger & Martinez (SFSU
- 2019: July 28-Aug 1:
- JSM Denver. ISLP Session (Jan) Schield: Statistical Literacy: A Study of Confounding
- 2019: May 16-18:
- USCOTS State College Pennsylvania Schield's Workshop
- 2019: Aug 13-16:
- IASE Satellite Conference. Kuala Lumpur. Malaysia
- 2019: July 27-Aug 1:
- ASA JSM Denver, Colorado
Sign Up For StatLit E-News
Get concise updates on what is happening. One to four e-mails per year on current events or site updates. Easy opt-out option as part of each e-mail. No passwords. No other member sees your name or address. No resale to any 3rd party. Over 1,100 members.
To sign up, enter your e-mail address, an optional name (real or fictional) and press Subscribe.
Subscribe to the Statistical Literacy News e-mail list.
