Website
Highlights: [10th year Anniversary]
-
StatLit.org still growing:
Downloads up 26%, Index views up 5%, Page views up 6%. Visits off 1%.
Around 30,000 home page views, 130,000 page views, 170,000 visits
and 245,000 downloads. Added two new pages: Blastland and Knapp.
Google ranked Wikipedia as #1 for statistical literacy, StatLit.org as #2, Schield at
Augsburg as #3. Wired Magazine's
2010 Statistical
Literacy as #4 and the
Univ. of Wollongong as #5. Schield's 2004 paper,
Statistical Literacy Curriculum
Design, at
CiteSeerX as #6. www.StatLit.org was reviewed as a "well-structured web site. Includes
a useful and extensive collection of links related to statistical
literacy" by
Tishkovskaya & Lancaster.
|
|
|
|
***
Selected by the StatLit webmaster |
|
|
|
Top 6 Most Downloaded
Articles from StatLit.org in 2012
-
Percentage
Graphs in USA Today. Milo Schield 2006 ASA (17,819; 19,114; 11,179;
13,253; 14,247; 8,809) Inception-to-date:
84,896.
-
Presenting Confounding Graphically Using Standardization
(4,646; 1289; 2084; 1985; 1616).
Milo Schield, 2006 STATS magazine
-
Interpreting the substantive significance of multivariate
regression coefficients. Jane Miller 2008 ASA
(3,118; 1625[11]; 2094; 1412) -
Statistical
Literacy: A New Mission for Data Producers. Milo Schield 2011
SJIAOS (2,815 [10]; 1723) -
Coincidence in Runs and Clusters. Milo
Schield 2012 MAA (2,466[9])
[New in 2012] -
Exploring Simpson's Paradox. Larry Lesser (Univ. Texas, El Paso) NCTM
2001 (1,686[9]; 1143[9]; 2043[11]; 2844; 913)
|
Top 12 Most Downloaded Articles from
StatLit.org in 2012
-
Statistics for Political Science
Majors. Gary Klass 2004 ASA (1,416[10]; 1389[10]; 596[6]; 765; 215) -
Ambiguity
Intolerance: An Impediment to Inferential Reasoning?
Robert Carver 2006 ASA (1,370 [11]; 1220; 624[5]; 797) -
Developing
statistical literacy with students and teachers in the secondary
mathematics classroom. Masters Thesis. Doyle (1,136[4]; 597[5]; 1811[9]) -
Importance and Measurement of
Pre-Service Teachers' Efficacy to Teach Statistics... 2009 ASA Harrell et al. (1,075[8]; 1753[11]; 2506) -
The
Reliability of Measuring Instruments. Thomas R. Knapp 2009. (1,027[7])
[Newly hosted in 2012] -
Teaching Statistical Literacy as Quantitative Rhetoric. ASA 2010
John Schmit 6up (986[8]; 1187[9];
279[2]
|
|
NUMERACY
(NNN) JOURNAL |
 Numeracy:
E-Journal Numeracy:
E-Journal
Numeracy is an open-access, peer-reviewed
journal launched in 2008. Numeracy aims to support
education at all levels that integrates quantitative skills across
disciplines. The journal seeks evidence-based articles. See Vacher's
NECQL and
PKAL presentations. |
  Numeracy
Editors Numeracy
Editors
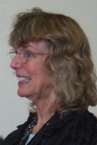
Len Vacher (left) and Dorothy Wallace (right)
are editors of Numeracy: Advancing Education in Quantitative
Literacy published by the National
Numeracy Network, supported by U. of S. Florida Libraries and hosted
by
the Berkeley Electronic Press™.
NNN listserv |
2012: Volume
5,
Issue 1
|
2012: Volume 5,
Issue 2
|
GRANTS FOR QR, QL and STATISTICS |
 QL
and QR
Assessment QL
and QR
Assessment
NSF
awards $192,253 to Bowdoin College for "Collaborative
Research: Quantitative Literacy and Reasoning Assessment (QLRA)."
Goals: "developing a non-proprietary QLR instrument, ... to begin the
creation of a database of QLR abilities, and establishing an online
resource portal for QLR assessment." PI: Eric Gaze (left); Co-PI:
Linda Misener. Two-year grant
1140562. |
 QL-QR
Assessment QL-QR
Assessment
NSF
awards $28,094 to Colby-Sawyer College for "Collaborative
Research: Quantitative Literacy and Reasoning Assessment (QLRA)." Goal: "Developing
a non-proprietary QLR instrument [and] piloting it at several
participating institutions across the country.. " PI: Semra
Kilic-Bahi . Two-year grant
1140584. |
 Graph
Literacy Activities Graph
Literacy Activities
NSF
awards $298,816 to the Concord Consortium for "Piloting
Graph Literacy Activities in Maine." Goal is to "develop and
pilot test a limited number of free computer-based instructional
activities that improve student graph comprehension, aimed especially at
science students in grades 7 and 8." PI
Carolyn Staudt
(right). Co-PI
Andrew Zucker. Two-year grant
1256490 |
 Manipulating
Numeracy Manipulating
Numeracy
NSF
awards $369,735 to Ohio State for "Manipulating numeracy:
Causal effects on judgments and decisions."
Goal: Investigate "whether improving number ability will subsequently
improve how people make decisions." It "will focus on
numeracy's causal role in decision-making abilities and outcomes [study
1] and on math attitudes [study 2]." PI
Ellen Peters. 3-yr grant:
1155924 |
 Improve
QL via Intro Science Improve
QL via Intro Science
NSF
awards $199,535 to U. of Arizona for "An Informed Approach
to Improving Quantitative Literacy and Mitigating Math Anxiety in
Undergraduates through Introductory Science Courses." QL skills
"include graph reading, proportionality, percentages, probability and
number sense." PI:
Donald
McCarthy (left). Co-PIs: Katherine Follette & Erin Dokter.
3-year grant: 1140398. |
 QL
in Preschool Children QL
in Preschool Children
NSF
awards $1,910,980 to Univ. of Missouri to study the "Development
of Quantitative Competencies in Preschool Children." Competencies
include number, number relations, and number operations as well as
language, executive function, attention, IQ, and social behavior. PI:
David Geary (left). Co-PIs:
Jeffrey Rouder and Kristy vanMarle. Five-year longitudinal study
1250359
|
 School
Teachers Development School
Teachers Development
NSF
awards $85,681 to Univ. Louisville Research Foundation for "CAREER:
Investigating Middle and Secondary Mathematics Teachers' Transformative
Learning of Statistics within Professional Development." The goal
is to investigate "teachers' statistical reasoning" and support
"teachers' development ... about variation." PI:
Susan Peters. Five-year grant
1149403 |
 Randomization-based
Curriculum Randomization-based
Curriculum
NSF
awards $181,478 to Dordt College (IA) to develop an "Innovative
Randomization-based Introductory Statistics Curriculum."
Goal: Provide instructors with a "fully integrated set of curriculum
materials ... that introduces statistical inference from the start" PI:
Nathan Tintle (right). Co-PIs: Allan Rossman, Beth Chance, Todd
Swanson and Soma Roy. Two-year grant
1140629. |
 NSF
Awards: 2007-2012 NSF
Awards: 2007-2012
NSF awards mentioning these phrases by start-year
(2012,
11, 10, 9, 8, 7): numeracy (3,1,2,3,6,1), quantitative
reasoning (7,4,5,3,4,4), quantitative literacy (6,1,3,5,6,2), statistical
thinking (2,3,4,2,0,1), statistical
reasoning (1,1,2,0,0,0) and stat literacy (1,0,0,0,0,0). NSF
database:
QR (108),
QL (55),
numeracy (36),
ST (33),
SR (29),
SL (13)?? |
 Understanding
Evolution: QL-CC Understanding
Evolution: QL-CC
NSF
awards $405,000 to U. Utah for "Building High School
Students' Understanding of Evolution--Both Common Ancestry and Natural
Selection--Through Mathematical Arguments." Show how "QL
and Common Core Standards of Mathematics can be addressed in the
biology curriculum." PI:
Louisa Stark (left). Co-PIs: J. Roseman, K. Pompei & D. Drits-Esser. Two-year grant
1222869 |
|
NEW POPULAR BOOKS |
 Signal
and the Noise Signal
and the Noise
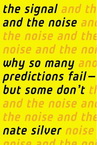
The Signal and the Noise: Why So Many Predictions Fail — but Some
Don't by Nate Silver. "Both experts and laypeople mistake more
confident predictions for more accurate ones. But overconfidence is
often the reason for failure. If our appreciation of uncertainty
improves, our predictions can get better too. This is the “prediction
paradox”."
Interview. |
 Antifragile:
Gaining from Disorder Antifragile:
Gaining from Disorder
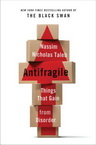
Antifragile: Things That Gain
from Disorder by Nassim Nicholas Taleb.
Examples: "Rule 1: Think of the economy as being more like a cat than a
washing machine." "Rule 3: Small is beautiful, but it is also
efficient." "Rule 4: Trial and error beats academic knowledge." "Rule 5:
Decision makers must have skin in the game."
WSJ “Changed my view of how the world works.”—Daniel
Kahneman. |
|
 Untangling
Skill and Luck Untangling
Skill and Luck
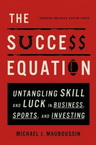
The Success Equation: Untangling Skill and Luck in Business, Sports,
and Investing by Michael Mauboussin. “Much of what we experience in
life results from a combination of skill and luck.” "The trick, of
course, is figuring out just how many of our successes (and failures)
can be attributed to each—and how we can learn to tell the difference
ahead of time."
Website |
 Half-Life
of Facts Half-Life
of Facts
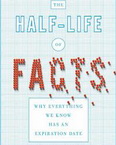
The Half-life of Facts: Why Everything We Know Has an Expiration Date
by Samuel Arbesman. "scientometrics — literally the science
of science. Knowledge in most fields evolves systematically and
predictably, and this evolution unfolds in a fascinating way..."
"new ways to measure the world while accepting the limits of how much we
can know with certainty. " |
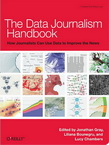 The
Data Journalism Handbook The
Data Journalism Handbook
The Data Journalism Handbook How Journalists Can Use
Data to Improve the News By Jonathan Gray,
Lucy Chambers, and Liliana Bounegru. Publisher: O'Reilly Media Released:
July 2012 Pages: 242.
Free pdf |
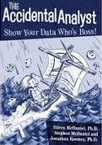 The
Accidental Analyst: The
Accidental Analyst:
The Accidental Analyst: Show Your Data Who's Boss by Eileen McDaniel
and Stephen McDaniel. "learn how to analyze your data to find
answers to real-world questions." ... "find creative ideas on how
to work with accidental analysts. Using illustrated examples, we'll walk
you through a clear, step-by-step framework that we call The Seven C's
of Data Analysis." 300 pages $26. |
NEW BOOKS: INFOGRAPHICS & EXPLANATION |
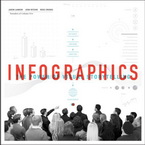 Infographics:
Storytelling Infographics:
Storytelling
Infographics: The Power of Visual Storytelling by Lankow, Ritchie
and Crooks. In today's fast-paced environment, you must
communicate your message in a .. way that sets it apart from the noise.
Visual content ... can accomplish this. ... Shows you how to find
stories in your data, and how to visually communicate .. them .. for
maximum impact. |
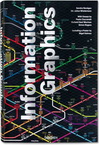 Information
Graphics Information
Graphics
Information Graphics by
Sandra Rendgen. How complex ideas can be
communicated via graphics. “If you can’t explain it simply, you don’t
understand it well enough.” —Albert Einstein. Features: 200
projects and over 400 examples of contemporary information graphics from
all over the world—ranging from journalism to art, government,
education, business and much more |
|
 Power
of Infographics Power
of Infographics
Power of Infographics: Using Pictures to Communicate and Connect With
Your Audiences by Mark Smiciklas. "Need to overcome
information overload and get your message across? Infographics are your
secret weapon." "reveals how to use infographics both inside and
outside the organization: to build brands, make sales, serve clients,
align teams behind new strategies, ..." |
 Art
of Explanation Art
of Explanation
The Art of Explanation: Making your Ideas, Products, and Services
Easier to Understand by Lee LeFever. becoming an explanation
specialist. Your product or service works beautifully - but
something is missing. People just don't see the big idea - and it's
keeping you from being successful. Your idea has an explanation problem. |
NEW BOOKS: EDUCATION/NUMERACY/SPORTS |
|
 Problem
with Math is English Problem
with Math is English
The Problem with Math Is English by
Concepcion Molina illustrates how students often understand
fundamental mathematical concepts at a superficial level. Examine math concepts "through the lenses of
language and symbolism.." Topics: multiplication, division, fractions,
place value, proportional reasoning, graphs, slope, order of operations,
and the distributive property.
|
 Putting
Faces on the Data Putting
Faces on the Data
Putting FACES on the Data: What Great Leaders
Do! by Lyn Sharratt and Michael Fullan. "The authors show how
to develop a common language for sharing all students’ progress with
teachers and leaders, and how to use ongoing assessment to inform
instruction." Integrates "data to improve schools and systems, and
data to improve the individual child's learning experience."
SAGE |
 Mathematical
Literacy Mathematical
Literacy
Mathematical Literacy in the Middle and High School Grades: A Modern
Approach to Sparking Student Interest by Faith Wallace and Mary Anna
Evans. "helps teachers find and use
engrossing ways to introduce math concepts through stories, using
hands-on activities to reinforce the concepts." |
 Scorecasting:
Hidden Influences Scorecasting:
Hidden Influences
Scorecasting: The Hidden Influences
Behind How Sports Are Played and Games Are Won by Tobias Moskowitz
and L. Jon Wertheim. "reveal the hidden forces that shape how
basketball, baseball, football, and hockey games are played, won and
lost" "unintended consequences of referees' tendencies in every
sport to "swallow the whistle," "will forever change how you view the
game,". |
NEW PROFESSIONAL BOOKS |
 Natural
"Experiments" Natural
"Experiments"
Natural Experiments in the Social Sciences: A Design-Based Approach
(Strategies for Social Inquiry) pb by Thad Dunning. "the first
comprehensive guide to the discovery, analysis, and evaluation of
natural experiments - an increasingly popular methodology in the social
sciences" "highlights both the strengths and potential weaknesses"
CUP |
 Quantitative
Literacy Quantitative
Literacy
Quantitative Literacy: What Is It? How You Use It Each Day!
[Paperback] Elisabeth H Knowlton. Targets "the mathematics of art,
social science, management science, probability, statistics and problem
solving using real-world applications." Chapters: Fair
division, voting, graph theory, Routing, Scheduling, Golden Numbers, and
Probability, Data Analysis and Problem Solving. |
 Who's
#1: Science of Rating ... Who's
#1: Science of Rating ...
Who's #1?: The Science of Rating and Ranking by Amy N. Langville and
Carl D. Meyer. "the first comprehensive overview of the
mathematical algorithms and methods used to rate and rank sports teams,
political candidates, products, Web pages, and more." "showing why
their strengths and weaknesses depend on the underlying goal," |
 Measures
of Association Measures
of Association
By G. David
Garson, full professor of public administration at North Carolina
State University. Measures of association discussed in this volume
are for dichotomous, nominal, ordinal, or mixed data. Note that with the
exception of eta, when data are mixed by data level, the researcher uses
a measure of association for the lower data level. Dr. Garson has books
on Measurement levels and logistic regression. |
 Risk
Communication in Health Risk
Communication in Health
Risk Communication in Health by Dr. Nicolai
Bodemer and Wolfgang Gaissmaier in Handbook of Risk Theory, pp
621-660. "we discuss how transparent risk
communication can ... be achieved". "we will explain and discuss four
formats – relative risks, conditional probabilities, 5-year survival
rates, and single-event probabilities – that often confuse people, and
propose alternative formats ..." $525 |
 Causality:
Statistical Perspectives Causality:
Statistical Perspectives
Causality: Statistical Perspectives and Applications (Wiley
Series in Probability and Statistics). Editors: Carlo Berzuini,
Philip Dawid and Luisa Bernardinell. "Presents a wide-ranging collection
of seminal contributions by renowned experts in the field, providing a
thorough treatment of all aspects of statistical causality. It covers
the various formalisms in current use, methods for applying them to
specific problems, and the special requirements of a range of
examples..." Articles by Pearl, Greenlander, Cox and Rosenbaum. |
SELECTED SLIDESHOWS |
 Simple
Statistics Simple
Statistics
Deming and statistical strategies to
make observational studies more reliable by Stanley Young. Webinar
on December 12, 2012 for Society of Toxicology - Risk Assessment
Specialty Sections (RASS). Bottom line: 1. Trust no claims
from observational studies. 2. If multiple testing is an
issue, write editor. 3. If data not public, write funding
agency/congressman."
Audio. |
Schield Slideshow Presentations
Victor Cohn (1919-2000): A Retrospective: Twin Cities ASA
10/14/2012.
Statistical Literacy & Critical Thinking Keene State College. More
5/15/12
Coincidence in Run and Clusters. StatChat Macalester College,
3/8/12.
Statistical Literacy: Math-Stat Alternative T3Conference Chicago
3/2/12
Statistical Literacy for All. StatLit at Augsburg. Lehman College. 2/25/12 |
NEW TEXTBOOKS |
 Making
Fair Comparisons Making
Fair Comparisons
Making Fair Comparisons: A
Free textbook for Quantitative Literacy courses by
Michael
Caulfield.
[Get current pic]
|
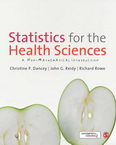 Statistics
for Health Sciences Statistics
for Health Sciences
Statistics for the Health Sciences: A Non-Mathematical Introduction
by Dancey, Reidy and Rowe. "clear explanations of the concepts
underlying statistical analyzes and descriptions of how these analyzes
are applied in health sciences research without complex statistical
formulae. The book takes students from the basics of research design,
hypothesis testing ..." 2012 |
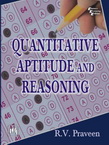 Quantitative
Aptitude-Reasoning Quantitative
Aptitude-Reasoning
By R.V. Praveen. Goal: to help students
"solve the problems within the stipulated time and that too with the
higher degree of accuracy. Each chapter contains numerous worked-out
examples and practice exercises. The questions range from purely numeric
calculations to problems of arithmetic reasoning, graph and table
reading, percentage analysis and quantitative analysis. |
Unlocking
the Power of Data
The Lock family have authored
Statistics: Unlocking the Power of Data by Robin H. Lock, Patti
Frazer Lock, Kari Lock Morgan and Eric F. Lock.
2012
|
|
STATS 2011*** |
 Trevor
Butterworth, editor of STATS, contributes to the
Financial Times, Forbes, and the Wall Street Journal. Trevor
Butterworth, editor of STATS, contributes to the
Financial Times, Forbes, and the Wall Street Journal.
ABC's Persecution Of Presidential Award-Winning Scientist Continues.
Pop a tab and pour a lie "white-hat bias: a tendency to
distort information to advance good causes "
More private liquor stores, more alcohol deaths? A.Norton
Top 50 statistics blogs of
2011. |
 Rebecca
Goldin, STATS Director of Research, is on the
Mathematics faculty at George Mason University. Rebecca
Goldin, STATS Director of Research, is on the
Mathematics faculty at George Mason University.
Brilliant ideas from the Washington Post: Learning math
is stupid! Goldin and Merrick.
High Wired: Does Addictive Internet Use Restructure the Brain?
STATS: We want people to
think about the numbers behind the news.
Stats essays for
2011. |
|
StatLit Workshops: 2012 |
 Keene
State College Keene
State College
A 3-day faculty workshop organized by Mike Caulfield and Shari Bemis.
Schield talks: 1 Statistical Literacy
6up; 2 Critical Thinking
6up; 3 Coincidence
6up; 5 Reading Tables
6up; 6 Reading Graphs
6up; 7 Statistical Literacy
and Math 6up; 8 Confounding
6up. May 15-17. |
 Lehman
College CUNY Lehman
College CUNY
A one-day faculty workshop organized by Esther
Wilder (right) at Lehman College: City University of New York (Feb 24).
Milo's class 6up
1up. Math
6up. |
|
Statistical Literacy
@ Augsburg |
 Statistical
Literacy: Coincidence Statistical
Literacy: Coincidence
In the first fall Statistical Literacy class, students tried to find out
who was the luckiest. They each flipped a quarter 10 times and
counted the length of their longest run. When asked how they would
distinguish skill from coincidence, they immediately replied:
"Repetition". They recognized that "the
unlikely happens given enough tries" and "coincidences seldom repeat".
Fall 2012. |
 Student
writing is critical to any course that tries to promote critical
thinking. The Augsburg Statistical Literacy course used the
new 2012 V9 version of Odyssey2Sense.
Students completed
24 challenges
and then reflected on their experiences. Fall 2012. Student
writing is critical to any course that tries to promote critical
thinking. The Augsburg Statistical Literacy course used the
new 2012 V9 version of Odyssey2Sense.
Students completed
24 challenges
and then reflected on their experiences. Fall 2012. |
|
Math/Stat Education in the UK |
Future of UK Statistics
The Future of Statistics [in the UK] (2012) by Roger Porkess.
Published by the RSS, London. (Summary - Statistics in our schools
and colleges – summary 41). |
Quantitative
Skills in Social Science
Society Counts: Quantitative Skills in the
Social Sciences (A Position Paper). Published by the British
Academy. (2012). London. (Summary: Society Counts Summary). |
|
UK Statistical Publications:
2012 |
 Significance
(RSS/ASA) Significance
(RSS/ASA)
** A century and a half of
moral statistics in the UK By Cook and Wainer, June. **
Robbing banks: Crime does pay – but not very much. By Reilly,
Rickman and Witt, June. ** Are first-borns more
likely to attend Harvard? By Millner and Calel, June. **
A thing of beauty [Resolving Galton's Paradox] by O'Hagan, June.
** The formula that killed Wall Street. Salmon, Feb. |
 Teaching
Statistics: Issue 1 Teaching
Statistics: Issue 1
High-speed hypotheses! (p 10) Lesser. **
What is a p-value (p 18) Humphrey. **
Sensitivity analysis in statistics teaching (p 38) Zhang and
Govindaraju. **
Difference between mathematics and statistics (p 44) Petocz and
Sowey. **
Creating, implementing and integrating a first-year statistics
requirement (p 50) Redington and Russell. |
 Teaching
Statistics: Issue 2 Teaching
Statistics: Issue 2
Lexical ambiguity: making a case against spread
(p 55) Kaplan, Rogness and Fisher. **
Three questions to identify trustworthy statistics (p 75) Petocz and
Sowey. **
A result concerning runs when tossing a fair coin (p 79) Gabhe,
Bhanu and Deshpande. **
Going beyond the book: towards critical reading in statistics teaching
(p 82) Andrew Gelman. |
 Teaching
Statistics: Issue 3 Teaching
Statistics: Issue 3
Business statistics at the top 50 US business programmes
(p 92) Haskin and Krehbiel. **
Teaching Statistics – from the beginning (p 104) Barnett and Holmes.
**
Using snakes to constrict statistics anxiety (p 111) Lesser.
**
A visual demonstration of the sample median (p 112) Mahmood. |
|
Statistical Education Research Journal (SERJ) |
Concept
Retention
Retention of Statistical Concepts in a Preliminary
Randomization-Based Introductory Statisitcs Curriculum.
By
Title (right), Topliff, Vanderstoep, Holmes, and Swanson. Students in a traditional course lost 48%
of their course gain within 4 months after the course. Students in
a randomization-based course lost only 6% of their gain.
SERJ May, 2012, p 21. |
 Attitudes, Concepts, Content Attitudes, Concepts, Content
Students’ Perceptions of Statistics: An Exploration of
Attitudes, Conceptualizations, and Content Knowledge of Statistics
by
Bond
(left), Perkins, and Ramirez. Overall attitude (positive/negative)
and reasons by discipline. SATS: During first 8 weeks, Interest dropped almost a
full standard deviation, while
Value and Effort dropped almost half a standard deviation.
SERJ: Nov, 2012 p. 6. |
 Statistics:
Irrelevant to Career Statistics:
Irrelevant to Career
Students’ Attitudes Toward Statistics Across the
Disciplines: A Mixed-Methods Approach by
Griffith
(left), Adams, Gu, Hart, and Nichols-Whitehead. Percentage
of those students with negative attitudes toward statistics (37% of all
students) as of 8th week of the course who cited "nonuse in future
career": business (46%), criminal justice (80%) and psychology (86%).
SERJ Nov 2012 p 45 |
 Attitudes
in Stats Ed. Attitudes
in Stats Ed.
Do Introductory Statistics Courses in the United States
Improve Students’ Attitudes? Schau (right)
& Emmioğlu. SATS: Value and Interest dropped a
third of a SD; Effort dropped half. "About 25% of the sections
moved from the positive into the neutral range for Value"
"attitudes in about half of the sections dropped by at least ½ point
from pretest to posttest" SERJ Nov2012, p.
86
|
|
CHANCE Magazine |
|
Assessing Statistics
[Topics] and Research Methodology in the MCAT Exam by Zhao, Dowd,
and Searcy. "Respondents were asked to rate the importance of having
knowledge about the topics and subtopics prior to entering medical
school for success during medical school. "
Making the Old New Again by Çetinkaya-Rundel, Stangl, and Morgan.
"When searching for a good instructional data set it is hard to find one
that is neither too simplistic nor too complex, and for this reason this
paper and the accompanying data are an educational goldmine." |
Statistics for Cigarette Sellers by Andrew Gelman.
"professional ethics demand that he [statisticians] give his best
approximation to the truth."
Medicine,
Statistics, and Education: The Inextricable Link by Brieger and
Hardin. "the training of doctors should aim to improve statistical
literacy. However, [this] has focused on introductory material, and we
argue that there is a need for advanced statistical literacy in the
health science"
Prediction Markets: How Accurate Are They? by Jonathan L. Wilson.
|
|
OTHER SOURCES |
ASA Journal of
Statistical Education
Statistical Education in 21st Century: a Review of Challenges, Teaching
Innovations & Strategies for Reform by Tishkovskaya & Lancaster
Redesigning a Large Introductory Course to Incorporate the GAISE
Guidelines by Woodard and McGowan. [Great list of course
outcomes!!]
Naive
Analysis of Variance by Braun.
Team-Based Learning in a Statistical Literacy Class by St. Clair &
Chihara.
A
Case Study on Teaching the Topic “Experimental Unit” and How it is
Presented in Advanced Placement Statistics Textbooks by Perrett.
|
Other Statistical Literacy
web sites
Statistical Modeling, Causal
Inference, and Social Science. Andrew Gelman‘s statistics blog with
entries organised by categories.
Go Figure.
Regular column by Michael Blastland about everyday statistics
STATS. Helps people to
think about the numbers behind the news.
Understanding Uncertainty.
David Spiegelhalter‘s project page.
Bad Science.
Ben Goldacre's website
www.makingfaircomparisons.us. A freely available textbook
created for a General Education course on Quantitative Literacy.
By Michael Caulfield. |
Other Journals:
A four-stage framework for assessing statistical literacy by Sharma,
Sashi; Doyle, Phil; Shandil, Viney; Talakia'atu, Semisi. Abstract:
"The growing importance of statistics in today's information world and
conceptions of statistical literacy are outlined and models for
developing statistical literacy from research literature are considered.
A four-stage framework for assessing statistical literacy from our
design research is proposed. " |
From
Blogs in 2012
|
|
QUOTES |
|
STATISTICAL LITERACY
-
Coincidence quotes from the past: “Mr Bond, they have a saying in Chicago:
'Once is happenstance. Twice is coincidence. The third time it's
enemy action'.” ― Ian Fleming, Goldfinger
Variations: "Once is an Accident, twice is a Coincidence, and
three times is a Pattern"; “Once is an accident, twice is a
coincidence, three times is a habit” has been cited in print since
at least 1921. “Once is nothing, twice is coincidence, three times
is a moral certainty” has been cited in print since 1923.
"Once is a mistake, twice a coincidence, three times is a pattern";
"Once a misfortune, twice a coincidence, three times an issue";
"once is luck. twice is coincidence. three times is skill"; "Once is
fluke. Twice is coincidence. Three times is a pattern"; "Once a
misfortune, twice a coincidence, three times an issue."
Humor: TEACHER: What does "coincidence" mean? STUDENT: Funny, I was
just going to ask you that. :)
NUMERACY
- "I focus on the most important form of innumeracy in everyday
life, statistical innumeracy--that is, the inability to reason about
uncertainties and risk." --Gerd Gigerenzer, in Calculated Risks:
How to Know When Numbers Deceive You.
SOCIAL CAUSALITY
2012 e-COTS:
"Using A Fact
Based World View To Engage Students" with Hans Rosling, Karolinska
Institute. e-COTS Keynote address.
Major global changes are gradual and powerful, but many are too slow to
reach the news media, and yet too fast to have made it to the textbooks.
The Gapminder Foundation has found that new technologies allow for
animation of international statistics and story-telling about major
global trends. Hopefully this will help students see the beauty of
statistics and encourage them to upgrade their knowladge and acquire a
fact-based worldview. [60 min; 55mb]
2012 e-COTS:
Using advertisements to teach statistical literacy
by Rose Martinez-Dawson, Clemson University.
The modern student watches an average of 125 hours of television each
month and during this time sees more than 1,600 thirty-second television
commercials (Herr). In addition, more than 10 years ago, the average college
student was on the Internet 100 minutes per day (Anderson, 2001), a figure
that has only increased since then. For each 100 minutes on the Internet,
approximately 16 minutes of these consists of viewing advertisements. One of
the most popular sites visited on the Internet, Youtube, watched 7.4 hours
monthly by the typical Youtube viewer (www.frankwbaker.com/mediause.htm), is
a platform by which advertisers reach consumers through the use of
stationary and pop-up advertisements. In short, students today are inundated
with advertisements on television, Internet and print media; we can and
should take advantage of this and use advertisements as a tool to teach
statistical literacy. In the Hierarchical Model of statistical
literacy (Watson, 1997), statistical literacy is composed of three tiers of
which developing a "questioning attitude" is the highest level. This
attitude involves a more sophisticated understanding of statistical concepts
to challenge claims. Because today's student is accustomed to advertising
claims both on television and on the Internet, educators have an excellent
opportunity to incorporate them into course material as a means of
developing this questioning component of statistical literacy. During
this seminar, participants will be shown a variety of advertisements
including print advertisements and commercials accessed from Youtube that
can be used to enhance this questioning attitude of statistical literacy. In
addition, results from research involving the use of advertisements on
challenges students made to statistical claims in advertisements will be
discussed. The audience will participate in a demonstration to illustrate
this approach to teaching statistical literacy. Participants will gain an
understanding of the role advertisements can play in teaching statistical
literacy and ways in which advertisements can be incorporated into their
courses. [30 min; 25 mb]
2012 e-COTS:
"A Second
Statistics Course is Needed: What should it be?" with Marc Isaacson and
Milo Schield, Augsburg College.
Big data, AP stats and the common core are driving the need for a
"second" statistics course. What should it be? Isaacson will argue for a
Statistical Literacy course that emphasizes breadth. Schield will argue
for an advanced-topics follow-on course that emphasizes depth. Isaacson
will argue that the traditional inference course doesn't have time for
important topics such as coincidences, confounding, evaluating surveys
and studies, and "Where do statistics come from?" so a statistical
literacy course is needed. Schield will argue that the 50% of college
graduates who are in quantitative majors and are required to take a
statistical inference course need a follow-on applications course. This
course should focus on inference-related applications (ANOVA and web
analytics), modelling (linear and logistic regression), simulation (boot
strapping and financial modeling) and other advanced topics (factor and
cluster analysis; epidemiology and causation in observational studies).
Participants will be given specific examples of each topic so they can
better appreciate their value to students. Participants will be invited
to support either side or both during the presentation. [Schield has
taught the advanced modelling course using linear and logistic
regression, an MBA course in quantitative methods, and is using web
analytics to make business decisions. Isaacson developed the first
Statistical Literacy course online and the first Statistical Literacy
for Managers course.] [30 min; 26mb]
2012 e-COTS: "Big
Data Generates Beguiling Coincidences" with Milo Schield,
Augsburg College. Today's data users face a data deluge: data is
everywhere in massive amounts. Big data leads to the omni-presence of
coincidence which leads people to conclude that there is something more
going on than "mere" chance. Educators often see this differently, and
ponder how to lead students to a more accurate idea of "expected." This
presentation argues that coincidences are more likely because of what is
unseen and presents a probabilistic approach to "expected." Spreadsheets are
presented that help make the unseen more visible and help students challenge
and develop their notion of "expected". These spreadsheets demonstrate
coincidence with runs with coins, with linear and non-linear clusters in a
two-dimensional grid, and with the Birthday problem. Coincidences are
explained mathematically and geographically. Participants will access the
ideas and the materials and assess their inclusion in an intro stats course.
[5 minutes; 4 mb]
|
|
IMPORTANT ARTICLES |
|
'Raise standards for preclinical cancer research', C. Glenn
Begley and Lee Ellis (Nature 483, 531–533; 2012). Nature comment:
"scientists at Amgen ... were able to reproduce findings in only 11% of
53 published papers."
Comment:
Scientific Reproducibility: Begley's Six Rules by
B. Booth Forbes
Are
Medical Conferences Useful? And for Whom? John P. A. Ioannidis, MD,
DSc JAMA. 2012;307(12):1257-1258. doi:10.1001/jama.2012.360.
Also
2
Simpson's Paradox and
the Association Between Vitamin D Deficiency and Increased Heart Disease.
Authors: Chan, William K.1,2 Redelmeier, Donald A.1,2,3,4 dar@ices.on.ca
Source: American Journal of Cardiology. Jul2012, Vol. 110 Issue 1,
p143-144. 2p.
Confounding
variables in epidemiologic studies: Basics and Beyond by Farin
Kamangar in the 2012 Archives of Iranian Medicine. [Good
overview/introduction. The distinction between quantitative and
qualitative confounders does not involve the kind of data; it defines
the power of the confounder. Qualitative confounders can change the
direction; quantitative confounders can only change the magnitude. Ed.] |
Confound those damned
confounders. Authors: Sleigh, J. W.1 Source: Anaesthesia & Intensive
Care. Jul2012, Vol. 40 Issue 4, p593-594. "discusses a study which
clarified the idea that redheads are resistant to general anesthesia, by
Myles and colleagues, published within the issue. He commends the study
authors for showing how confounding variable, such as gender, affects
outcome. The author argues that the anesthesiology profession should
always consider the principle of balanced skepticism."
What Is Hidden in My
Data? Practical Strategies to Reveal Yule–Simpson’s Paradox and
Strengthen Research Quality in Health Education Research. Authors:
Smith, Matthew Lee1 Goltz, Heather H.2 Source: Health Promotion
Practice. Sep2012, Vol. 13 Issue 5, p637-641. 5p |
|
OTHER JOURNAL ARTICLES |
|
Statistical Literacy and Statistics
The Health Literacy
Skills Instrument: A 10-Item Short Form. By Bann, mcCormack, Berkman
and Squiers. Journal of Health Communication. Nov2012 Supplement 3, Vol.
17, p191-202. DOI: 10.1080/10810730.2012.718042.
Supporting statistical literacy: What do culturally
relevant/realistic tasks show us about the nature of pupil engagement
with statistics? By: Carvalho and Solomon. International
Journal of Educational Research. Nov2012, Vol. 55, p57-65. 9p. DOI:
10.1016/j.ijer.2012.06.006.
Taking a Chance in the Classroom: Uncounted Votes: A Case Study in
Analyzing Aggregated Data. By Stangl, Çetinkaya-Rundel and
Lock-Morgan. Chance. Winter2012, Vol. 25 Issue 1, p18-23. 6p. DOI:
10.1080/09332480.2012.668460.
Statistical judgments are influenced by the implied likelihood that
samples represent the same population. Detail Only Available By:
Chesney, Dana; Obrecht, Natalie. Memory & Cognition. Apr2012, Vol. 40
Issue 3, p420-433. 14p. DOI: 10.3758/s13421-011-0155-3.
Predictive Analytics: Microsoft Excel (1st ed) by Conrad Carlberg |
Quantitative Literacy and Reasoning
Measuring Risk Literacy:
The Berlin Numeracy Test. Full Text Available. By Cokely,
Galesic, Schulz, Ghazal and Garcia-Retamero. Judgment & Decision Making.
Feb2012, Vol. 7 Issue 1, p25-47. 23p.
Developing Quantitative
Reasoning: Will Taking Traditional Math Courses Suffice? An Empirical
Study. By Agustin, Agustin, Brunkow and Thomas. JGE: Journal of
General Education. Oct2012, Vol. 61 Issue 4, p305-313. "The
authors state that taking one or more math courses does not develop
quantitative reasoning. They note that quantitative reasoning course
focuses on the practical application of mathematics while a traditional
math course concentrate on manipulative skills and algorithms."
Quantitative Courses in
a Liberal Education Program: A Case Study. By Wismath and Mackay.
JGE: The Journal of General Education. Oct2012, Vol. 61 Issue 4,
p314-322. 9p.
Book Review:
Quantitative Reasoning and the Environment: Mathematical Modeling in
Context. Mathematics Magazine. Oct2012, Vol. 85 Issue 4, p303-303.
2/5p. DOI: 10.4169/math.mag.85.4.302.
Learning
Interdisciplinary Pedagogies. By Friedow, Blankenship, Green,
and Stroup. Pedagogy. Fall2012, Vol. 12 Issue 3, p405-424. 20p. |
Numeracy
When and for whom do frequencies facilitate performance? On the role of
numerical literacy. Detail Only Available By: Hill, W. Trey; Brase,
Gary L. Quarterly Journal of Experimental Psychology. Dec2012, Vol. 65
Issue 12, p2343-2368. 26p. DOI: 10.1080/17470218.2012.687004
Annual numeracy tests to
be introduced in 2013. Full Text Available Education Journal.
7/13/2012, Issue 134, p15-15. 1p.
Computer-based
instruction for improving student nurses’ general numeracy: is it
effective? Two randomised trials. Detail Only Available By:
Ainsworth, Hannah; Gilchrist, Mollie; Grant, Celia; Hewitt, Catherine;
Ford, Sue; Petrie, Moira; Torgerson, Carole J.; Torgerson, David J.
Educational Studies (03055698). May2012, Vol. 38 Issue 2, p151-163. 13p.
DOI: 10.1080/03055698.2011.598668.
Teaching Numeracy: 9
Critical Habits to Ignite Mathematical Thinking. Detail Only
Available By: Reisch, Christopher. Mathematics Teacher. Sep2012, Vol.
106 Issue 2, p158-158. 1/3p.
news & numbers. Full
Text Available Adults Learning. Spring2012, Vol. 23 Issue 3, p6-7.
The Theory-Based
Influence of Map Features on Risk Beliefs: Self-Reports of What Is Seen
and Understood for Maps Depicting an Environmental Health Hazard.
Detail Only Available By: Severtson, Dolores J.; Vatovec, Christine.
Journal of Health Communication. Aug2012, Vol. 17 Issue 7, p836-856.
21p. DOI: 10.1080/10810730.2011.650933. |
Numeracy (continued) and Innumeracy
Mathematics and Numeracy: Has anything changed? Are we any clearer?
Are we on track? Full Text Available By: Hogan, John. Australian
Mathematics Teacher. Oct2012, Vol. 68 Issue 4, p4-7.
Mathematics and numeracy--Is there a difference?
Full Text Available Australian Mathematics Teacher. Oct2012, Vol. 68
Issue 4, p8-11.
Numeracy across the curriculum. Full Text Available. By: Goos,
Dole and Geiger. Australian Mathematics Teacher. Mar2012, Vol. 68 Issue
1, p3-7.
Numeracy in Society and Environment. Full Text Available. By
Cooper, Dole, Geiger and Goos. Australian Mathematics Teacher. Mar2012,
Vol. 68 Issue 1, p16-20.
Numeracy in Health and Physical Education. Full Text Available By
Peters, Geiger, Goos and Dole. Australian Mathematics Teacher. Mar2012,
Vol. 68 Issue 1, p21-27.
Numeracy for What's in the News and Building an Expressway. Full
Text Available By: Willis, Kym; Geiger, Vince; Goos, Merrilyn; Dole,
Shelley. Australian Mathematics Teacher. Mar2012, Vol. 68 Issue 1,
p9-15.
Beyond Comprehension: The Role of Numeracy in Judgments and Decisions.
Detail Only Available By Peters, Ellen. Current Directions in
Psychological Science (Sage Publications Inc.). Feb2012, Vol. 21 Issue
1, p31-35. 5p. DOI: 10.1177/0963721411429960.
What We Don't Know Can Hurt Our Patients: Physician Innumeracy and
Overuse of Screening Tests. Full Text Available By: Moyer, Virginia A.
Annals of Internal Medicine. 3/6/2012, Vol. 156 Issue 5, p392-393. 2p.
|
|
eCOTS
2012 |
 eCOTS
2012 eCOTS
2012
The first Electronic Conference on Teaching Statistics (e-COTS)
was hosted by CAUSE May 14-18.
Agenda. This first eCOTS
had three themes: (1) Teaching Statistics: Debating some of the Big
Ideas, (2) Statistics for the Modern Student and (3) Reaching Out and
Building Relationships Beyond the College Statistics. |
 eCOTS
2012 eCOTS
2012
The 2012 eCOTS was organized/chaired by
Michelle Everson.
Keynote speakers and breakout
sessions
Other noteworthy sessions included "Using
advertisements to teach statistical literacy" with Rose
Martinez-Dawson and Robert Horton, Clemson University |
 A Second
Course is Needed: A Second
Course is Needed:
Video: In one of the 14 invited "big idea" breakout sessions, Isaacson and
Schield agreed that statistical educators should give strong support for
a second course since data was increasingly common and statistical tools
were more accessible. But they disagreed on what that
course should be.
Isaacson argued for statistical literacy; Schield argued for an updated
follow-on course.
Abstract |
 Big
Data: Coincidence Big
Data: Coincidence
Milo Schield (Augsburg) presented a 5
minute webinar:
Big Data
Generates Beguiling Coincidences.
Points: "Coincidence" is much more likely than expected!!! Three
explanations: (1) May involve an ambiguity (ex-ante vs. ex-post);
(2) May involve Law of Very-Large Numbers. (3) May be a sign
of causation.
Abstract
6up-slides
video (5min, 8mb)
|
|
ASA: Statistical Literacy Session |
 Statistical
Literacy #15 Statistical
Literacy #15
Milo Schield organized and
chaired the 15th
topic-contributed session on Statistical Literacy with
50-60 attendees in San Diego, CA. The rankings shown are from attendee evaluations of
the 45 papers presented in sessions sponsored by Statistical Education
Section.
Kathy Hall presented "Is Statistical Literacy at Risk with Common
Core Standards?"
Abstract
6up.
|
 Clinical
Numeracy
Ranked #1/45 Clinical
Numeracy
Ranked #1/45
Tanner Caverly presented Clinical Numeracy - Getting the Gist
of Health Risks.
Abstract
6up
Talk
"...preliminary work on the development of the Critical Risk
Interpretation Test which ... evaluates ... a clinician’s risk gist.
Finally, we discuss how the conceptual framework ... allows us to test
hypotheses regarding the effect of risk gist on risk communication tasks
and medical decision making." |
Causal
Heterogeneity Ranked #9/45
Milo Schield (Augsburg College) presented
How Causal Heterogeneity Influences
Statistical Significance in Clinical Trials in a regular contributed
session. Using
Weisberg's 2011 approach, Schield
showed how a lack of statistical significance could be entirely due to
causal heterogeneity in a clinical trial where the treatment is
sufficient to produce the desired effect in some of the subjects.
6up
|
 Statistical
Survival Skills Ranked #4/45 Statistical
Survival Skills Ranked #4/45
Marc Isaacson (Augsburg
College) presented
Lost: Assessing Student Basic
Survival Skills in the Statistical Wilderness Using Real Data.
"this activity probes student understanding" of "summary statistics,
tables and graphs" as presented in the US. Wildlife Survey. Most (76%)
clearly demonstrated the "confusion of the
inverse". 6up |
Numeracy
Infusion
Ester Wilder (Lehman)
presented
Teaching Quantitative Reasoning
Skills: A Numeracy Infusion Course for Higher Education (NICHE).
Goal: "to reduce the QR anxieties and improve the QR competencies of
participating faculty" by offering "a predominantly online Numeracy
Infusion Course for Higher Education (NICHE) designed to train faculty
in a wide range of disciplines." 6up.
|
 Social
Statistics: The stepchild Social
Statistics: The stepchild
How Economic and Social Statistics became the Stepchildren of the
Profession by Othmar Winkler. "how probabilistic
thinking began to dominate leading to the mistaken identification of all
statistics with ‘mathematical statistics’ with the consequence that the
mathematical formulas and models have ... lead to a stagnation of
Socio-economic statistics proper...." |
|
ASA JSM |
 Teaching
Confounding Teaching
Confounding
Teaching and Learning Confounding
in the Health Sciences by
Enders (left), Kroehl, McGready and Carter. "Case vignettes are a
good initial approach to teaching confounding through class discussion
in a problem-based learning approach. We believe it is possible to
use brief problem-based learning exercises to add considerable depth to
students’ understanding of confounding." |
Pollution-Mortality
A Closer Look at Air
Pollution-Mortality Relationships for California Members of the American
Cancer Society Cohort by Frederick W. Lipfert (Consultant) and
S. Stanley Young
(NISS, left). "we find no relationship between PM 2.5 exposures
... and all-cause mortality in California from 1982-2000."
See also Young's slides on improving observational study results. |
 New
Test for Randomness New
Test for Randomness
A New Test
For Randomness with Application to Stock Market Index Data by
Alicia Strandberg (right) and Boris Iglewicz (Temple U.). "This
nonparametric test is designed to detect deviations of neighboring
observations from randomness, especially when the dataset consists of
time series observations. The proposed test is especially effective for
larger dataset." |
 Normality
Test in Classroom Normality
Test in Classroom
Developing a Test of Normality in the Classroom by
Robert W.
Jernigan (American University). Abstract. "he importance of
looking at the data, an analyst’s intuition and experience in modeling,
sampling distributions, hypothesis testing, power, QQ plots, and
correlation are all reviewed and reinforced." See also
his collection of pictures that
illustrate statistical concepts. |
Interesting talks (abstract only; no
paper)
Roles of Language in Teaching Statistics: Research and Practice
544. Fisher, Kaplan and Wagler (Lesser)
Causation in
Statistics: A Gentle Introduction by Judea Pearl
Abstract
Stochastic Counterfactuals, Sufficient Causes, and Quantum Mechanics
by James Robins and Tyler VanderWeele.
Abstract
Model deconstruction and Hill causality by
William Heavlin
Abstract. |
Interesting talks (abstract
only; no paper)
Making instrumental variables look more
like experimental design by Baiocchi and Small.
Abstract
Two Intent-to-Treat Principles by Thomas Permutt (FDA).
Abstract
Is Deming's Red Bead Experiment Misleading? By Goldsmith.
Abstract
Application of the Shewhart Philosophy and Methodology to Create
Insights from Analytics by Chris H. Holloman, Thomas A. Bishop and
Wes Hunt
abstract |
NEW BOOKS:
SCIENCE AND STATISTICS |
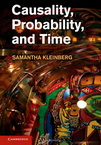 Causality,
Probability & Time Causality,
Probability & Time
by Samantha Kleinberg (Nov 11, 2012)
"Causality is a key part of many fields and facets of life..."
"presents a new approach to inference (finding relationships from a set
of data) and explanation (assessing why a particular event occurred),
addressing both the timing and complexity of relationships. The
practical use of the method developed is illustrated through theoretical
and experimental" cases. |
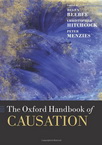 Handbook of Causation Handbook of Causation
by Beebee,
Hitchcock and Menzies. "Overview as well as the history of
the causation debate". "The chapters provide surveys of contemporary
debates, while often also advancing novel and controversial claims; and
each includes a comprehensive bibliography and suggestions for further
reading. "the most comprehensive source of information about causation
currently available". |
NEW EDITIONS |
|
 Damned
Lies and Statistics (2nd) Damned
Lies and Statistics (2nd)
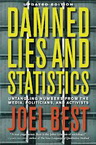
Damned Lies and Statistics: Untangling
Numbers from the Media, Politicians, and Activists by Joel Best.
"In his new afterword, Best uses examples from recent policy debates to
reflect on the challenges to improving statistical literacy." "Numbers
imply that a claim is factual. In our world, knowingly misusing
numbers is scandalous. Why? Because we depend on numbers."
|
 Statistical
Modeling (2nd ed) Statistical
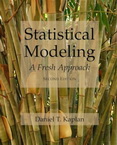
Modeling (2nd ed)
By Daniel Kaplan. By coupling computing with "an innovative geometrical presentation of the relationship among
variables, A Fresh Approach reveals the logic of statistical inference
and empowers the reader to use and understand techniques such as
analysis of covariance that appear widely in published research but are
hardly ever found in introductory texts." |
 Statistics
Unplugged (4th ed) Statistics
Unplugged (4th ed)
Sally Caldwell: "helps you understand
the relevance of statistics to your own life. Interesting examples ...
allow you to see what is really going on with the numbers instead of
being overwhelmed by the numbers themselves.." Review: " best job
of introducing introductory statistical concepts." Gives "foundation
upon which to build your statistical repertoire." |
 Epidemiology:
Introduction (2nd) Epidemiology:
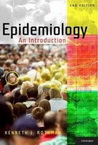
Introduction (2nd)
Epidemiology: An Introduction (2nd ed) by Kenneth J. Rothman. "The
text focuses on concepts, not on mathematics, and discusses statistical
techniques in the context of the real problems they can solve. This text
bridges the gap between what is taught in an introductory statistics
text and what you need to be an effective researcher and analyst." --
STATA " |
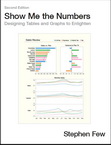 Designing
Tables and Graphs (2nd) Designing
Tables and Graphs (2nd)
Show Me the Numbers: Designing Tables and Graphs to Enlighten (2nd ed)
by Stephen Few. "the most accessible, practical, and comprehensive
guide to table and graph design available."
Review Visual Business intelligence@PerceptualEdge. |
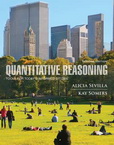 QR:
Tools for Informed Citizens QR:
Tools for Informed Citizens
Quantitative Reasoning: Tools for Today's Informed Citizen [2nd
ed] by Alicia Sevilla and Kay Somers. "builds upon the
1st issue with more ways to help readers handle complex, real-life,
every-day situations such as understanding credit card offers, balancing
checkbooks, and computing restaurant tips. more ways for connecting
mathematics with applications ...." |
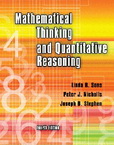 Mathematical
Thinking & QR (5) Mathematical
Thinking & QR (5)
Mathematical Thinking and Quantitative Reasoning (5th ed, loose leaf) by
Linda Sons, Peter J. Nicholls and Stephen Joseph. [See
StatLit 2008/2009??? for details on 2008 edition.] |
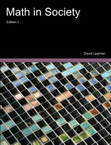 Math
in Society (2nd ed) Math
in Society (2nd ed)
A survey of mathematics for the liberal arts major (2nd ed) by David
Lippman. Chapters: Problem Solving, Voting Theory, Weighted
Voting, Apportionment, Fair Division, Graph Theory, Scheduling, Growth
Models, Finance, Statistics, Describing Data, Probability, Sets,
Historical Counting Systems, Fractals and Cryptography.
Open text
version.
|
- 2012 ASA President's Message:
Statistical Literacy and the 2013 International Year of Statistics.
Copy.
"Statistical literacy can no longer
be viewed as a skill needed by a select few; it is essential knowledge
required by all that must be developed beginning at an early age and
built on throughout one’s school years."
- 2012 Nov 15:
Educators' Statistical Literacy: Graduate Education University of
Melbourne. Principals and teachers are now expected to make data driven
decisions regarding planning and practice. This project is examining
principals’ and teachers’ attitudes to, and perceptions of,
statistical reports as well as their skills in interpreting such
quantitative information. Surveys and focus groups have been used to
collect data from 900 respondents. Researchers include Ian
Gordon and Robyn Pierce (U. Melbourne), and
Jane Watson and Helen Chick (U. Tasmania).
PDF.
-
2012 Nov 11:
Scoop.It: Mathematical and Statistical Literacy. Curated by
Emily C. Shahan. “Artifacts of mathematical/statistical work in the world to bring
into a mathematics classroom.”
Emily
Shahan, MEC Consultant and mathematics teacher. Emily taught
high school, middle school, and upper elementary students prior to
returning to graduate school in teacher education at Stanford to
pursue a degree in mathematics education. Currently a Lecturer at
Vanderbilt University, she studies the teaching and learning of
introductory algebra and teaches pre-service elementary and
secondary math teachers.
Vanderbilt 2008: Emily Shahan, assistant professor of the
practice of mathematics education (M.A., 2001, Stanford University;
B.A., 1995, Williams College)
-
2012 Nov 10:
Nate Silver: Why I Started FiveThirtyEight.
Checkout his new book,
The Signal and the Noise. Contrasts Bayesian ideology with
Frequentists approaches to forecasting.
-
2012 Nov 1:
Causality
in Statistics Education Prize established by the ASA and
funded by Judea Pearl.
Applications due by Feb 28. See
Ron
Wassestein's interview of Judea Pearl. See Pearl's review
of Econometric textbooks.
-
2012 Oct 22:
Statistical Literacy for Journalists: A Tribute to Victor Cohn.
Augsburg College 6-8 PM.
Sponsored by the Twin Cities Chapter of the American Statistical
Association and the Media Committee of the International Statistical
Literacy Project. Speakers: Milo Schield (Augsburg
College), Lewis
Copes (Minneapolis Star and Tribune, Retired) and
Deborah Cohn
Runkle (Sr. Program Associate, AAAS).
-
2012 Oct 18:
Telegraph 'Statistical illiteracy' leaves citizens at risk of
being duped by politicians and businessmen, warns British Academy.
Highlighting a strong of studies
in which employers “lament” modern graduates’ lack of numeracy, it
goes on to warn of implications for everyday life. “Without
statistical understanding citizens, voters and consumers cannot play
a full part,” it insists. “To call politicians, media and business
to account, we need the skills to know when spurious arguments are
being advanced.”
PDF.
-
2012 Oct 16:
British
Academy releases a position statement: "Society
Counts: Quantitative Skills in the Social Sciences and Humanities".
"The British Academy is deeply
concerned that the UK is weak in quantitative skills, in particular
but not exclusively in the social sciences and humanities. This
deficit has serious implications for the future of the UK’s status
as a world leader in research and higher education, for the
employability of our graduates, and for the competitiveness of the
UK’s economy." "With moves towards more open access to large
scale databases and the increase in data generated by a digital
society – all combined with our increasing data-processing power –
more and more debate is likely to turn on statistical arguments.
Providing citizens with the means to understand, analyse and
criticise data becomes ever more integral to the functioning of a
democracy."
-
2012 Oct 7: APA Guidelines V 2.0
Statistics. Statistical Sage blog.
Outcomes that are related to statistics: 1.2e Students will be
able to interpret simple graphs and statistical findings. (p 25)
1.2E Students will be able to describe the importance of specific
statistical findings and complex graphs in the context of its level
of statistical significance. (p 25) 1.4f Students will be able
to select, apply, and interpret appropriate descriptive statistics
to derive valid conclusions regarding research outcomes. (p 27) 1.4F
Students will be able to select, apply and interpret appropriate
inferential statistics to derive valid conclusions regarding
research outcomes. (p 27) 3.1f Students will be able to interpret
quantitative data displayed in statistics, graphs, and tables,
including statistical symbols in research reports. (p 41) 3.1F
Students will be able to construct appropriate display of
quantitative data in statistics, graphs, and tables.
In areas that are very closely related to applied statistics, and
I’m suspecting that most of you cover in your applied statistics
classes we have the following outcomes.
1.4 a Students will be able to describe various research methods
used by psychologist including their respective advantages and
disadvantages. (p 27) 1.4A Students will be able to evaluate the
effectiveness of quantitative and qualitative research methods in
addressing relevant research questions. (p 27) 1.4b Students
will be able to discuss the value of experimental designs (i.e.,
controlled comparisons) in justifying cause-effect relationships. (p
27) 1.4B Students will be able to limit cause-effect claims to
research strategies that appropriately rule out alternative
explanations. (p 27) 1.4e Students will be able to explain why
conclusions in psychological projects must be both reliable and
valid. (p 27) 1.4E Students will be able to design and
adopt high quality measurement strategies that enhance reliability
and validity. (p 27)
-
2012 Oct 3:
Can we afford Statistical Literacy?
RSS Workshop Plymouth Univ.
David Walker (Chair ESRC Methods and Infrastructure Committee) and
John Pullinger (Chair of the UK Data Forum President-Elect of the
Royal Statistical Society). "The getstats Campaign
presentation will draw on evidence about public misunderstanding of
frequency, risk and probability and will chart its potential cost in
the consumption of collective goods such as health and education and
in commercial markets. It will then turn to model the benefits of
higher levels of statistical literacy on productivity and resource
allocation. The talk will outline the ambitions of the Royal
Statistical Society getstats Campaign, noting challenges to and
opportunities for professional statisticians in widening public
understanding and the applications of statistical techniques."
-
2012 Sept:
Statistical literacy course (SCIL 07001)
Univ
of Edinburgh. Organized by Dr. John Macinnes
(Sociology).
Description
Details
-
2012 Aug 31:
How I Created a
Trapezoidal Display of Simpson's Paradox by
Arjun Tan,
Prof Emeritus at Alabama A&M Univ.
The trapezoidal display of Simpson's paradox has been independently
created at least three times. Lesser (2001)
notes Tan (1986). Wainer and Brown (2004)
note Jeon, Chung and Bae (1987) and Baker and Kramer (2001).
-
2012 Aug 14:
Made it! An uncanny number of psychology findings manage to scrape
into statistical significance by E. J. Masicampo at Wake Forest
University, USA, and David Lalande at Université du Québec à
Chicoutimi. "an unusually large number of psychology findings are reported as
"just significant" in statistical terms. The pattern of results
could be indicative of dubious research practices, in which
researchers nudge their results towards significance, for example by
excluding troublesome outliers or adding new participants. Or it
could reflect a selective publication bias in the discipline - an
obsession with reporting results that have the magic stamp of
statistical significance. Most likely it reflects a combination of
both these influences."
-
2012 Aug 3:
Understanding risk statistics about breast cancer screening by
Fiona Fidler and
Bonnie Wintle (Univ. Melbourne).
Explains why five-year survival rates are misleading in terms of
lead-time bias and over-diagnosis bias. "Improved statistical
literacy about breast cancer screening is vital because it means
that people can make informed decisions about screening and seek a
second opinion if a test comes back positive."
-
2012 July 11:
Steve Ziliak comments on Soyer-Hogarth's
Visualizing Economic Uncertainty.
"expert econometricians themselves—our best number crunchers—make
better predictions when only graphical information—such as a scatter
plot and theoretical linear regression line—is provided to them.
Give them t-statistics and fits of R-squared for the same data and
regression model and their forecasting ability declines. Give them
only t-statistics and fits of R-squared and predictions fall from
bad to worse."
-
2012 July 5:
On students’ conceptions of arithmetic average: the case of
inference from a fixed total.
By Dov Zazkis at San Diego State University in the
International Journal of Mathematical
Education in Science & Technology. Abstract: There is more
to understanding the concept of mean than simply knowing and
applying the add-them-up and divide algorithm. In the following, we
discuss a component of understanding the mean – inference from a
fixed total – that has been largely ignored by researchers studying
students understanding of mean. We add this component to the list of
types of reasoning needed to understand mean and discuss student
responses to tasks designed to elicit this component of reasoning.
These responses reveal that inference from a fixed total reasoning
is rare even in advanced high school students.
DOI:10.1080/0020739X.2012.703338.
-
2012 June 22:
Data Literacy for Journalists.
"data literacy is the ability to consume for knowledge, produce
coherently and think critically about data." References the Data
Journalism Handbook (See below).
-
2012 June 20:
Saint Joseph's
College Looks to Improve Quantitative Literacy with $10K Grant.
The focus of the faculty development workshop sponsored by this
grant is to help faculty create hands-on activities with data
acquisition equipment that will enhance students' quantitative
thinking." In 2011, St. Joseph received a $10K grant from
Vernier for purchase of Vernier data-collection technology.
Sept 23, 2011
-
2012 June 18:
Klass publishes Second Edition of "Just Plain Data Analysis."
"Gary Klass, associate professor of politics and government, has
recently published the second edition of his book, Just Plain Data
Analysis. The book is designed to teach statistical literacy skills
that students can use to evaluate and construct arguments about
public affairs issues that are grounded in numerical evidence. The
book also mentions skills that are often not taught in introductory
social science research methods courses and that are often covered
sketchily in the research methods textbooks: where to find commonly
used measures of political and social conditions; how to assess the
reliability and validity of specific indicators; how to present data
efficiently in charts and tables; how to avoid common
misinterpretations and misrepresentations of data; and how to
evaluate causal arguments based on numerical data. This
new edition has a chapter on statistical fallacies and many updates
throughout. It also teaches students to find, interpret, and present
information in a clearer and more practical way."
Amazon. "This second edition has four new new chapters
that are a must-read for anyone interested in where statistics come
from and how they are formed by our choices." Milo Schield.
-
2012 May 14:
NSF
Request for ideas about a Mathematics Education Initiative.
"This funding [$60 M] will create a dual-agency initiative on
mathematics education that will combine the strengths of NSF and ED
to stimulate needed research and development in mathematics
education and the use of successful practices and innovations at
scale. This initiative will support researchers, practitioners, and
institutions with the greatest potential for transformational
impact, and provide opportunities for state, local and institutional
decision-makers to infuse proven practices into mathematics
education. The goal is to have a lasting impact on the learning and
teaching of mathematics." Deadline: July 1, 2012.
"Explain the priority issue, challenge, or opportunity; provide a
brief rationale for its importance; and comment on the implications
it has for the teaching and learning of mathematics at the K-16
level. Provide the evidence or research base that supports the
priority issue, challenge, or opportunity you have identified,
including references, if appropriate."
-
2012 May 4:
Math-QL Academic Position at Bay Path College in Longmeadow, MA.
"The College is very eager to
refocus our mathematics and statistics courses on quantitative
literacy and numeracy with a special effort to building these skills
into numerous components of our entire curriculum. We are especially
interested in an individual – regardless of academic preparation –
who can help to lead this effort."
-
2012 April 26:
Coincidences: What are the chances of them happening? By
David Spiegelhalter. BBC News.
PDF
-
2012 April 24:
Data and Statistical Literacy. An interactive
web-based tutorial that promotes the development of critical
thinking and [information] evaluative skills.
Posted by
Susan Metcalf (Western Carolina University) on MERLOT:
Multimedia Educational Resource for Learning and Online Teaching.
-
2012 April: "Welcome
to Statistical Literacy, the science of understanding".
This site is about statistical literacy in Farsi. It is trying to
help society to understand statistics and its applications. Try it
and enjoy...
Site owner: Afshin Ashofteh (). "Statistical literacy is a
term used to describe an individual's or group's ability to
understand statistics. Statistical literacy is necessary for
citizens to understand material presented in publications such as
newspapers, television and the internet. Numeracy is a
prerequisite to being statistically literate. Being
statistical literate is sometimes taken to include having both the
ability to critically evaluate statistical material and to
appreciate the relevance of statistically-based approaches to all
aspects of life in general." "Upper limit minds discuss
ideas; Average minds discuss events; Lower limit minds discuss
people."
-
2012 Apr 5:
Education,
statistics and the big data future by Tom King (RSS News)
PDF.
-
2012 Apr 2: Statways:
New statistics course aims to accelerate college students’ path to
success. EdSource Extra
-
2012 Mar 27: Obama administration
to push big data agenda
by Barb Darrow (blog).
"Here are three things the feds could do right off the bat to
promote better use of big data:(1) put the government’s own data
sets into open formats, (2) push states to include a data or
statistical literacy component in their education plans, and (3)
establish ways to continuously collect data on prescribed topics as
opposed to relying on temporary snapshots"
-
2012 March:
Data Journalism
Handbook 1.0 beta. Edited by Jonathan Gray, Liliana
Bounegru and Lucy Chambers.
-
2012 Mar 23:
Statistical Literacy blog by Armin Grossenbacher. Good
overview of data literacy, visualization and communication.
-
2012 Mar 22:
Statistical
literacy in film studies I by Nick Redfern (blog)
Statistical
literacy in film studies II
-
2012 Mar 22:
RSSCSE Pathways to Teaching
Statistics.
Information
-
2012 Mar 16: New book:
Student Writing in the Quantitative Disciplines: A Guide for College
Faculty by Patrick Bahls.
-
2012 Feb 21:
Math Matters: America's Innumeracy by Walter Williams.
-
2012 Feb 8:
Millions, Billions, Zillions: Why (In)numeracy Matters
by Brian Kernighan (Berkman Fellow & Department of Computer Science,
Princeton University) at Harvard Univ.
PDF
-
2012 Feb 6:
Presentation Skills: Bring Statistics to Life
-- by Carmine Gallo in Forbes. "Statistics often don’t mean much if
left on their own. In fact, the bigger the number, the more
important it is to put into context. Have fun with it. Brainstorm
ways to add context around the statistic and bring it to life with
interesting, compelling PowerPoint visuals. It’s estimated that on
any given day 30 million PowerPoint presentations are delivered.
That’s the equivalent of 20,000 presentations started every minute.
Most of those presentations are bland, confusing, and convoluted,
especially if they are full of statistics, charts and graphs. Don’t
add to the confusion. By bringing statistics to life, your audience
will be more likely to recall the information later and thoroughly
enjoy your presentation."
-
2012 Feb 1:
RSS GetStats: Proposes
12 ‘number
hygiene’ rules for journalists.
Two-page text-only copy
Blog
-
2012 Feb:
Project-SET (Statistics
Education for Teachers) Opens new NSF-funded
website for those interested in teacher preparation.
-
2012 Jan 19
RSS Report: The Future of Statistics in our Schools and Colleges
by Roger Porkness. "Policy
on mathematics post-16 should ensure that a large majority of young
people continue with some form of mathematics post-16." See Table
11: Statistics topics in the A level Mathematics [No mention of
confounding] "The ideas of correlation and causation, often linked
together, are widely used outside mathematics. More could be done
within mathematics to emphasise the danger of assuming that correlation
implies causation." "It is very likely that new post-16 courses will
soon be developed... <snip> These courses will be designed for those
who currently do no mathematics or statistics beyond GCSE. Since
many such students are currently very glad to have given up all
forms of mathematics, the new courses will only be successful if
they succeed in engaging the interest and enthusiasm of this
clientele. They will require careful design and the statistical
content, and the way that it is presented, will be critical in
this." "Another ever-present danger is that those who do not
understand the value of statistics exert political pressure for a
reduction in the extent to which it is taught: 'More algebra and
less data handling' is a beguiling message."
-
2012 Jan 13 UTSA QLP Program
Guidelines for Q-Course Grant Submission Proposals (Due
Jan 13, 2012).
Q-Course Proposal Worksheet.
Quantitative Literacy Course (Q-course) Development Grants:
Invitation to faculty (11/7/2011). All based on the
8 "EVALUATE" learning outcomes.
-
2012 Jan 3:
The Big Mistake: Teaching stat as though it were math by Douglas
Andrews, ASA. "The foundation of stat is in
empirical science and in learning from observed data, not in math."
-
2012 Dec 21. “Connecting
Research to Practice in a Culture of Assessment for Introductory
College-level Statistics.
Released by CAUSE. Excerpts: "As the field and practice of
statistics has changed, it has become more difficult to provide an
agreed upon list of specific topics or procedures that all students
should learn." (1) Cognitive Outcomes: "Research Priority 1:
What are the core learning outcomes of statistics that students
should develop in order to be statistically literate citizens...?"
Examples of questions: "What core learning outcomes help people to
make informed decisions based on data on a daily basis (e.g., what
types of statistical literacy are needed to understand statistical
information in the media and other public forums)?" (4)
Teaching Practice: "Research Priority 1: Research Priority 1: What
are effective instructional approaches for developing or improving
particular learning outcomes (e.g., statistical literacy,
statistical thinking, conceptual understanding, informal inferential
reasoning)?" Examples of questions: "What types of effects
does using real data for instruction and assessment have on
students' statistical literacy?" "What are the essential
characteristics of active learning instruction that support the
development of statistical literacy and thinking in students?"
(6) Technology: Research priority 3 (Curriculum): Examples of
questions: "How does the goal of producing statistically literate
citizens change the curriculum in light of new types of data and
sources of data brought on by technological advances (Gould, 2010)?"
-
2012 Dec 19: Wellesley employment for Quantitative Analysis
Institute Director. "Wellesley College is forming a new Quantitative Analysis Institute that will
serve both faculty and students in higher level quantitative work.
Please share this [two-year] job posting with individuals interested
in leading quantitative research and instruction."
-
2012 Dec. 6: Statistical Literacy taught using new version
(V9) of Odysseys2sense.
Augsburg students completed
24 challenges
that involved reading and evaluating numbers in the news Operating
the new system (6up,
1up slides)
-
2012:
US Census
Bureau Terminates US Statistical Abstract.
The Statistical Abstract of the United States, published since 1878,
is the authoritative and comprehensive summary of statistics on the
social, political, and economic organization of the United States.
The U.S. Census Bureau is terminating the collection of data for the
Statistical Compendia program effective October 1, 2011.
-
2012: Sept 12-14.
International Association of Official Statistics (IAOS).
Kiev, Ukraine. Topics and Panel include Statistical Literacy .
Sessions.
Abstracts due by Dec 1, 2011.
-
2012: Sept 13.
CUNY adopts QR in Common Core.
John Jay (CUNY) to hire 4 instructors for QR.
-
2012: July 29-Aug 2.
ASA Joint Statistical Meetings San Diego.
Online
program StatEd-sponsored sessions
Papers must be
uploaded by 11:59 p.m. EDT September 28.
SUN 4 pm Contributed session #74.
How Causal Heterogeneity can
Influence Statistical Significance in Clinical Trials by Milo
Schield 6up
Sun 4 pm Invited session
46.
Causation in Statistics: A Gentle Introduction
by Judea Pearl
Abstract
>
MON 7 - 8:15 am.
Breakfast roundtable
97. ML11:
Teaching epidemiological thinking by
Milo Schield
Abstract [cancelled]
MON 10:30 - 12:15.
Statistical Literacy 2012 session
156.
Is Statistical Literacy at
Risk with Common Core Standards? by Kathy Hall
Abstract
6up;
How Economic and Social Statistics became the
Stepchildren of the Profession by Othmar Winkler
Abstract;
Teaching Quantitative Reasoning Skills: A Numeracy Infusion Course for Higher
Education (NICHE) by Esther Wilder
Abstract
6up
Handouts; Clinician Numeracy
Clinical Numeracy - Getting the Gist of Health Risks by
Caverly et al.
Abstract
6up
Talk;
Lost:
Assessing Student Survival Skills in the Statistical
Wilderness using Real Data by Marc Isaacson
Abstract
6up.
Mon 10:30-12:15 Invited Session
266: A new u-statistic with superior design sensitivity in matched
observational studies by Paul R Rosenbaum, University of Pennsylvania
Abstract
Mon 12:30-1:50 Lunch roundtable:
ML22 ´Big Data’ in the Introductory Applied Statistics Course?
John McKenzie, Babson College
>
TUES 7-8:15 am. Breakfast roundtable
261
Observational studies and epidemiological thinking:
Interpreting health studies based on observational data by
Jareen Meinzen-Derr
Abstract.
Tues 8:30 - 5:00 Workshop ($370) CE_08C
Targeted Learning:
Causal Inference for Observational and Experimental Data
Tues
8:30 - 10:20 AM. Invited session
266. A new u-statistic with superior design sensitivity in
matched observational studies
by Paul R Rosenbaum.
Abstract
Tues 2-3:50 pm. Topic-contributed session
Improving
causal analysis in observational studies
391. Making instrumental variables look more like experimental design
by Baiocchi and Small
Abstract
Tues 2-3:50 pm. Topic contributed session
The Search for
Missing Data
383.
Two
Intent-to-Treat Principles by Thomas Permutt.
Abstract
>
WED 12:30-1:50
Roundtable: WL26 How Do We Adjust for Confounding Factors in
Environmental Health? Francesca Dominici, Harvard Univ.
Wed
2-3:50 pm. Invited session
Are Fine
Particulates Killing Californians?
545.
Background and Evaluation of Evidence by James E. Enstrom
Abstract
Wed 2-3:50 pm. Invited Session Roles of Language in Teaching
Statistics: Research and Practice
544. Fisher, Kaplan and Wagler (Lesser)
Wed 6-8: Statistical Education Section Business Meeting HQ-Sapphire
EF.
>
THURS:
8:30-10:30 am. Contributed session
Visualising complex models
611.
Model deconstruction and Hill causality by
William Heavlin
Abstract;
Thurs 10:30-12:30 Contributed session
Problems in Non-parametrics
650.
Instrumental variables for causal inference: deciding when to use
them by Boriska Toth and Mark van der Laan.
Abstract
-
2012: July 9-14.
World Congress on
Probability and Statistics. Istanbul.
-
2012: July 9-13.
RC33 Eighth
International Social Science Methodology.
University of Sydney. Open abstract submissions 2 Sept 2011; Close abstract submissions 1
December 2011; Papers due 10 April 2012
-
2012: July
9-12.
ASC2012. Australian Statistics Conference, Adelaide.
Other events.
Other
conferences
-
2012: July 8-15.
ICME-12
Seoul Korea. See TSG12: Teaching and learning of statistics. Deadline
for proposals: Nov 1, 2011. E-mail call for proposals: Topics of interest include
"Statistical literacy (its role in the curriculum, the challenges in
preparing teachers to teach with statistical literacy as a goal)"
ICME-12 website: "Statistical literacy and its role in the curriculum including the
content that is important for achieving statistical literacy and the
challenges in preparing teachers to teach with statistical literacy
as a goal. " -
2012: July 2-6:
IASE Roundtable Conference on Technology in Statistics Education:
Virtualities and Realities,
Cebu City Philippines. October 1,
2011 for submission of summaries of papers to the Chair of the 2012
Roundtable Scientific Program Committee.
-
2012 June 30
Endeavour Executive Award for study in Australia.
The Endeavour Executive Award aims to: • Enable high achieving
professionals to further develop their skills, knowledge and
leadership capabilities; • Deepen professional engagements between
Australia and participating countries; • Strengthen mutual
understanding between the people of Australia and Award Holders’
host countries; • Build international linkages and networks, and •
Allow professionals the opportunity, on returning to their home
country, to share their updated skills and knowledge with
colleagues. Applications due by June 30.
-
2012 June 27. eCOTS Sessions Publicly
available.
"The first biennial Electronic Conference on
Teaching Statistics (eCOTS) hosted by CAUSE (Consortium for the
Advancement of Undergraduate Statistics ), May 13-18, 2012, had 420
statistics educators and students registered. The conference, which
was presented over the internet, showcased three Statistics
Education themes: Debating the Big Ideas, Statistics for the Modern
Student, and Commercial Resources for Teaching Statistics. The eCOTS
conference content (audio & video) are now unrestricted and can be
viewed by everyone, not just the registered attendees. There are 14
breakout presentations, 22 virtual poster presentations, 4 panel
discussions and 2 keynote presentations." [Check out
these virtual poster sessions:
Using advertisements to teach statistical literacy
video with Rose Martinez-Dawson, Clemson University; and "Big Data
Creates Beguiling Coincidences" by Milo Schield. Checkout
this invited breakout session:"A
Second Statistics Course is Needed: What should it be?" by Marc
Isaacson and Milo Schield.]
-
2012 June 15.
Master/PhD Education Scholarship in Statistical Literacy at
Queensland University of Technology (Brisbane, AU).
Applications are invited from appropriately qualified individuals
for a scholarship to undertake either their Master of Education
(Research) or PhD in Education at Queensland University of
Technology (QUT), with the primary focus of the project being on
statistical literacy across grades 4 to 6. There is the option to
articulate from the MEd (Research) study to a PhD project. The
project: Statistical Literacy in the Primary School—Beginning
Inference. Across all walks of life, the need to understand
and apply statistical literacy is paramount. Residing in an age of
information explosion, young students more than ever need to reason
and deal critically with data. This three-year longitudinal study
will introduce a new and innovative approach to developing
statistical literacy in the primary school years (grades 4 to 6),
with a focus on beginning inference - a core component of
statistical literacy and an increasingly important life skill.
PDF
-
2012 June 11-14
6th Annual
International Conference on Mathematics, Statistics and Education
(Teaching) Mathematics and Statistics.
Athens, Greece. Contact: Professor Gregory T. Papanikos.
Organized by: Athens Institute for Education and Research.
Deadline for abstracts/proposals: 14 February 2012.
-
2012 June 4:
Pomona College Awarded $250,000 Grant for Quantitative Studies
Center.
"Pomona College was awarded a $250,000 grant by the
Arthur Vining Davis
Foundations to establish the new Quantitative Studies Center.
The new center will provide the quantitative skills support to aid
any student with interest in science, technology, engineering or
mathematics disciplines to succeed and persist, improve the
quantitative reasoning skills of all Pomona students and promote
quantitative literacy as a goal for all Pomona graduates."
PDF.
-
2012 June 1-3
IISSAM, the International Institute for SoTL Mentors and
Scholars.
Held at Loyola Marymount University, in Los Angeles, CA.
Plenary speakers: Mary Huber, Eric Strauss, and Jennifer Meta Robinson. Tony
Ciccone will lead a preconference
workshop on May 31, 2012.
Registration and call for posters.
-
2012 May 31 - June 2.
Quantitative Reasoning in Math and Science Education Symposium.
2nd
annoucement.
WISDOMe of the University of Wyoming, the NSF Pathways
Project, a multiple university Mathematics and Science Partnership
(MSP) housed at Colorado State University, and the Georgia Southern
University Office of Research invite you to participate in the
International STEM Research Symposium to be held in Savannah,
Georgia May 31 through June 2, 2012 at the Marriott Savannah
Riverfront Hotel. This symposium is a continuation of efforts in
WISDOMe
to establish an active research collaborative focused on
quantitative reasoning. This effort has already spawned a research
conference, working sessions at PME and NCTM, and a monograph on QR.
The symposium will incorporate four themes: Quantitative Reasoning
(QR), Mathematics as a Lived Experience (DIME), Technology in
Mathematics Teaching (TTAME), and Learning Progressions (LP). The
focus is on QR with discussions in the other three themes framed
within QR.
-
2012 May 14-18
eCOTS-2012:
Electronic Conference on Teaching Statistics.
"designed to focus on undergraduate-level statistics education
(including AP Statistics), with a target audience of statistics
teachers." Three themes: (1) Teaching Statistics: Debating
some of the Big Ideas, (2) Statistics for the Modern Student and (3)
Reaching Out and Building Relationships Beyond the College
Statistics.
Agenda (pdf).
eCOTS Keynote speakers and
breakout sessions.
Using advertisements to teach statistical literacy" with Rose
Martinez-Dawson, Clemson University. Tues
noon (EDT) Schield and Isaacson present a "big-ideas" webinar: "A ‘Second’
Statistics Course is Needed: What should it be?
Abstract.
Schield presents a poster-webinar:
Big Data Generates
Beguiling Coincidences.
Abstract
6up-slides
video (5min, 8mb)
-
2012 May 15-17. Keene State College plans Integrative
Quantitative
Literacy (IQL) Faculty workshop. Part of Keene's Integrative Studies Program (ISP). Milo
Schield gives seven talks and a workshop on statistical literacy.
1 Statistical Literacy 6up;
2 Critical Thinking 6up;
3 Coincidence 6up;
5 Reading Tables and Graphs 6up;
6 Reading Graphs and Tables 6up;
7 Statistical Literacy and Mathematics
6up;
8 Statistical Literacy: Confounding
6up.
-
2012 April 25: Deadline
Expression of
Interest (EoI) for Development and implementation of statistical
literacy university course for journalists.
Announcement.
Activity scope and Terms of References. Launch date: April 6.
-
2012 April 23.
Lecture: The development of statistical and mathematical literacy
by Iddo Gal at Stellenbosch University.
PDF
-
2012 April 18.
Mind
your confidence interval: how statistics skew research results
by Geoff Cumming, Emeritus Professor at La Trobe University
.
-
2012 April 14.
16th Annual Meeting of the Northeast Consortium on
Quantitative Literacy (NECQL)
Theme: Blended Learning and Technology in QL Education.
Skidmore College, Saratoga
Springs, NY
Program-
2012 April.
Team-Based Learning in a Statistical Literacy Class
by Katherine St. Clair and Laura Chihara (Carleton College). Journal
of Statistics Education Vol 20, Num 1.-
2012 March 8
StatChat Agenda:
Educating Citizen Statisticians by Rob Gould. Coincidence in
Runs and Clusters by Milo Schield
6up
1up.
Macalester College. -
2012 March 2. Statistics Symposium at
T^3 Conference
(Teachers Teaching Using Technology) in Chicago.
Statistics Symposium (10:15 a.m. - 5:15 p.m.) Day-long event
featuring presentations and panel discussions on issues related to
the teaching and learning of statistics and on topics that should be
part of a statistics curricula focused on preparing students for a
variety of future options. Presenters include George Cobb, Floyd
Bullard, Tim Erickson and other speakers from both academia and
industry. Milo Schield: Statistical Literacy: A Math-Stats
Alternative 6up
1up
"Good talk" George Cobb.
-
2012 Feb
24 Schield
Lecture on Quantitative Reasoning at Lehman College, NYC.
Statistical Literacy for All
1up
6up. Statistical
Literacy at Augsburg. 1up
6up.
Math dept 6up-
2012 Feb 22-24.
The Sixth Winter Institute On Statistical Literacy For Librarians
(WISLL).
University of Alberta Libraries. This training event will provide
strategies and skills for finding, evaluating and retrieving online
published statistics and will be useful to information professionals
working in academic, public and special libraries.
-
2012: Feb
16-18. 2012 ASA Conference on Statistical Practice Orlando, Florida.
-
2012: Jan
3-24:
Statistical Literacy course at the Brooklyn Brainery.
Taught by Matt Stevens. Four Tuesdays, 6:30-8:00 PM. $65.
"Statistical Literacy is a lecture course, with a few little games
thrown in, but we use as little math as possible, and nothing more
advanced than basic algebra, so beginners are welcome. This course
is devoted to the ideas behind statistics. These ideas are used in
everything from sports to gambling, from physics to opinion polls.
(1) We start with the question of causality: When correlation
means causation, when it doesn't, and how experiments work into it.
These ideas are key both to science and to everyday living. The kind
of science you see in the newspaper will never look the same again.
(2) Then we turn to summarizing variables. I'll show you some
beautiful graphs, some horribly ugly ones, and some of the ways they
can mislead you. We look at three meanings of "average," and how
they can be used to tell different stories. We wrap it all up with
"sigma" -- used in testing and engineering -- and the
"standardizing" of test scores. (3) Next we look for order in the
cloud. How to make sense of a scatterplot, what "correlation" means,
and look at the all-important "regression effect," critical to
understanding the "Sports Illustrated cover jinx." We'll touch on
the Ecological Fallacy, and how it affects our view of Red States
and Blue. (4) Finally, in the last section, we start by rolling dice
and flipping coins to find that the "law of averages" isn't a law at
all. That takes us to the Normal Curve, which helps us learn what
pollsters mean by "margin of error" and what scientists mean by
"statistical significance." (5) With these covered, you'll know just
about all the statistics you need to understand the modern world."
-
2012: Jan 4-7:
MAA Joint Mathematical Meeting. Boston.
Tues 8-5: Identify/Address Difficult Concepts in the
Introductory Statistics Course. Marjorie Bond.
MAA Ancillary Workshop.
Tues 9-4:30: Teaching Modeling-Based Calculus Hampton 3rd
Floor Sheraton. Daniel Kaplan, Daniel Flath, Randall Pruim and
Eric Marland.
Wed 9-11: Teaching introductory statistics.
Part A Salon
HI, 4th Floor, Marriott. MAA Minicourse #14.
Wed 9-10:20. MAA/NCTM Mutual Concerns Committee Panel Discussion
Why is transition from high school to college important? Issues and
next steps. Room 309, Hynes Organizer: Gail Burrill, Michigan
State. Panelists: Arthur Benjamin, Harvey Mudd College
David Bressoud, Macalester College William McCallum, University of
Arizona Daniel Teague, North Carolina School for Science and
Mathematics Paul Zorn, St. Olaf College
Wed 2:15-6:40. MAA-AMS Invited Paper Session on
the Philosophy of
Mathematics Room 302, Hynes Organizers: Thomas Drucker,
University of Wisconsin-Whitewater Bonnie Gold, Monmouth University
and Daniel Sloughter, Furman University. 2:15 p.m. Is Mathematics
the Language of Physics? Arthur M Jaffe*, Harvard University
(1077-AJ-71)
Wed 2:15 -3:35
Statistics and probability in the Common Core State Standards
Panel Discussion. SIGMAA-StatEd/ASA-MAA Joint
Committee on Statistics Education. Room 309, Hynes . Organizers: Nancy Boynton, SUNY Fredonia Gail Burrill, Michigan
State University Ann Watkins, California State University,
Northridge. Panelists: Christine Franklin, University
of Georgia Joan Garfield, University of Minnesota Roxy Peck,
California Polytechnic State University, San Luis Obispo J. Michael
Shaughnessy, National Council of Teachers of Mathematics Andrew
Zieffler, University of Minnesota
Wed 5:45 p.m.-7:15 p.m. SIGMAA on Statistics Education Business
Meeting and Reception Room 202, Hynes
Wed 8:30-9:30 PM A 250-year argument: Belief, behavior, and the
bootstrap. Ballrooms A/B, 3rd floor, Hynes Bradley Efron,
Stanford U.
Thursday 2-4 PM poster session: Quantitative Reasoning in the
Contemporary World. Stuart Boersma*, Bernard L. Madison, Caren
Diefenderfer and Shannon Dingman.
Thursday 2-4 PM poster session: Evaluation and Assessment of
Teaching and Learning About Statistics (e-ATLAS). Joan Garfield*,
Bob delMas and Andy Zieffler.
Friday: 9-11.
Teaching introductory statistics.
Part B Salon
HI, 4th Floor, Marriott MAA Minicourse #14.
Friday 5-6 p.m.
SIGMAA on Quantitative Literacy Business Meeting
Room 309, Hynes
Quantitative Literacy and Decision Making Friday, 8:00 –
10:55 a.m., Hynes 202 Organizers: Eric Gaze, Bowdoin College;
Cinnamon Hillyard, University of Washington Bothell; and Semra
Kilic-Bahi, Colby Sawyer College Description: Our
students are being asked to make decisions in an increasingly
complex world that require fundamental quantitative literacy in
diverse fields such as personal health, finance, and public policy.
The ability to reason from evidence by questioning assumptions and
premises, and assessing the veracity of claims is especially
critical when arguments are based on data and mathematical models.
Students' abilities to obtain, process, and understand information
related to such issues is crucial for them in making well-informed
decisions and participating in a democratic society. This session
seeks papers that discuss courses, classroom materials, curricular
and/or extracurricular activities that focus on exploring the use
and misuse of mathematical concepts related to making important
decisions that affect the personal, professional, and academic lives
of our students. All presentations are expected to be scholarly in
nature, including some evidence (qualitative or quantitative) of the
effectiveness of the activity. Sponsor: SIGMAA QL. Speakers: 9:00 a.m.
Using MS Excel to Improve Understanding
of Financial Mathematics. Paul Taylor*, Shippensburg University
(1077-L5-930) 9:20 a.m. Complex Systems and K-16 Curricula. R
W DeGray*, Saint Joseph College, Connecticut (1077-L5-1058) 9:40
a.m. The Financing Choices of American Consumers: The Influence
of Quantitative Literacy, Cognitive Disposition and Material Values.
Cinnamon Hillyard*, University of Washington Bothell Pete Nye,
University of Washington Bothell (1077-L5-1244) 10:00 a.m. The
Financial Literacy Project at Dartmouth College: Online Classroom
Resources and Modules. Eric C Gaze*, Bowdoin College
(1077-L5-2563)
Innovations in Teaching Statistics in the New Decade
Organizers:
Andrew Zieffler, University of Minnesota; Brian Gill, Seattle
Pacific University; and Nancy Boynton, SUNY Fredonia. Description: What have you found that is working particularly
well in your statistics class? What did you try that really didn't
work? What went wrong? Are there new technologies, websites,
textbook ancillary materials activities or other teaching methods
that are working well for you? What shouldn't we let go of from the
traditional courses? And what should we let go of? Tell us about
your course – especially what makes it successful. We encourage
contributions concerning either an introductory or a more advanced
undergraduate course. Sponsor: SIGMAA on Statistics
Education. Presenters will be considered for the Dex Whittinghill
Award for Best Contributed Paper.
Session I Friday, 1:00 – 6:00 p.m., Back Bay B, 2nd
floor Sheraton Hotel. 1:00 p.m. Introductory
Statistics with a Central Theme: "Statistical Reasoning" Courses
That Interest Students. David G Taylor*, Roanoke College Adam F
Childers, Roanoke College (1077-E5-907) 1:20 p.m. How the
Analysis of Current Economic Growth, Income and Employment Can Be
Used in Teaching an Introductory Statistics Course that Speaks to
Students. Alexander G. Atwood*, SUNY Suffolk County Community
College (1077-E5-2901) 1:40 p.m. Mathematics and the Law: How Big
Should a Jury Be, and How Should It Render Its Decision? Jeff A
Suzuki*, Brooklyn College (1077-E5-72) 2:00 p.m. Read and
Reflect: Making Statistics Real. Heather Hulett*, Univ. of
Wisconsin-La Crosse Barbara Bennie, Univ. of Wisconsin-La Crosse
(1077-E5-2631) 2:20 p.m. Statistics Scrapbooks in Elementary
Statistics. Julie Beier*, Mercer University (1077-E5-1660) 2:40
p.m. Using an Online Homework System in an Introductory
Statistics Course: Instructor and Student Perspectives. Lisa
Carnell*, High Point University (1077-E5-1849) 3:00 p.m. Descent
into `The Abyss' of Least-Squares Linear Regression. Charles
Bergeron*, Albany College of Pharmacy and Health Sciences David
Clarke, Albany College of Pharmacy and Health Sciences
(1077-E5-2782) 3:20 p.m. Playing Games with a Purpose. Shonda
Kuiper*, Grinnell College (1077-E5-1653) 3:40 p.m. Playing Games
with a Purpose: Initial Lessons from the Classroom. Kevin F.
Cummiskey*, United States Military Academy William H. Kaczynski,
United States Military Academy (1077-E5-1824) 4:00 p.m. Using R
in an Undergraduate Statistics Course. Judith E Canner*,
California State University, Monterey Bay Jon Detka, California
State University, Monterey Bay (1077-E5-741) 4:20 p.m. Probability Density Functions from Real-World Applications.
Annela R Kelly*, Bridgewater State University (1077-E5-2770) 4:40
p.m. Cutting Through the Theory: Emphasizing Statistical Thinking
in Mathematical Statistics. Jennifer L. Green*, University of
Nebraska-Lincoln Erin E. Blankenship, University of Nebraska-Lincoln
(1077-E5-2100) 5:00 p.m. Value and Relevance of an Engineering
Statistics Course. Kumer Das*, Lamar University, Beaumont, TX
(1077-E5-2547)
Session II Saturday 1-5 PM. Back Bay Ballroom C, 2nd
Floor, Sheraton. 4:20 p.m.
Coincidence
in Runs and Clusters Milo Schield*, Statistical Literacy Project (1077-E5-2503). 4:40 p.m.
A Statistical Odyssey:
Modernizing the Discussion Board to Enhance Student Engagement.
Kimberly J Presser*, Shippensburg University (1077-E5-1341)
Motivating Statistical and Quantitative Learning through
Social Engagement Saturday, 8:40 – 10:55 a.m., Hynes 203 Organizers: Brian Gill,
Seattle Pacific University; Eric Gaze, Bowdoin College; Andrew
Zieffler, University of Minnesota; and Stuart Boersma, Central
Washington University. Description: It is important for
our students to learn to apply statistics and quantitative methods
to real problems. Our students are interested in service learning
and civic engagement and they provide important ways for students to
both do useful work and also better understand the techniques that
they learn in their courses. Social justice is not often discussed
in mathematics or statistics courses; however, we can use
quantitative techniques to better understand the differences in the
lives of people in various segments of society. We invite
submissions that describe successful statistics or quantitative
literacy courses that include a service learning, social justice or
civic engagement component. Sponsors: SIGMAA on Statistics
Education and SIGMAA on Quantitative Literacy. Presenters
identifying their presentation as being about a statistics course
will be considered for the Dex Whittinghill Award for Best
Contributed Paper.
Speakers: 8:40 a.m. Mathematics for a Just World:
Teaching Quantitative Literacy Through Social Justice Issues and
Service Learning. Bonnie J Shulman*, Bates College, Lewiston, ME
(1077-J1-143) 9:00 a.m. Quantitative Literacy in a First-Year
Seminar Course. Maria G Fung*, Worcester State University
(1077-J1-1973) 9:20 a.m. Service Learning Project in a First-Year
Seminar. Zeynep Teymuroglu*, Rollins College (1077-J1-768) 9:40
a.m. Service-Learning Projects and Activities that Engage Liberal
Arts Mathematics Students: Implementation and Assessments.
Morteza Shafii-Mousavi*, Indiana University South Bend Paul
Kochanowski, Indiana University South Bend (1077-J1-169) 10:00 a.m.
Quantitative Reasoning and Informed Citizenship: Building
Students' Awareness of Social Issues. Alicia Sevilla*, Moravian
College Kay Somers, Moravian College (1077-J1-2467) 10:20 a.m. Math Trails in Undergraduate Mathematics. Mike Daven, Mount
Saint Mary College Lee Fothergill*, Mount Saint Mary College
(1077-J1-161) 10:40 a.m. How Does Acceptance of Lesbian and Gay
Men Spread in a Social Network? Angela Vierling-Claassen*,
Lesley University Dorea Vierling-Claassen, Brown University
(1077-J1-784)
2012 MAA Papers:
* The Source of Significance: Using Cost To Illuminate Statistical
Decision-Making by Hunter Ellinger and Mary Parker.
Abstract
* Properties of measures---Statistics investigations with Fathom by
William Finzer.
Abstract
* A Course in Statistics and Probability that Illustrates the
Recommendations of the MET Document by Christine Franklin.
Abstract
* Innovation in the teaching of introductory statistics: results of
a survey by Joan B Garfield.
Abstract
* CLT Revisited: A Demonstration of the Central Limit Theorem for an
Introductory Statistics Course. Jacqueline A Hall.
Abstract
* Introductory statistics laboratory projects using the TI-83 by
Patricia Humphrey.
Abstract
* A Fishy Introductory Statistics Course by Dick Jardine.
Abstract
* Ways to Incorporate Innovative Practices in an Applied Regression
Analysis Course by John D McKenzie, Jr.
Abstract
* Building and using mathematical models to guide decision making by
Ralph L. Keeney.
Abstract
* Statistical Experiments in the Natural Sciences by Colleen G.
Livingston.
Abstract
* Collaborative Learning and the Use of Technology: Experiences
Gained from a Statistics Course. Maria M Meletiou.
Abstract
* Thinking critically about issues in science: Using statistics to
reinforce skepticism. Judith F Moran.
Abstract
* The American Statistical Association's Undergraduate Statistics
Education [for Statisticians] Initiative (USEI). Mary R Parker.
Abstract
* Using Technology to Develop Understanding of Statistical Concepts
by Roxy L Peck.
Abstract
* Service-Learning in Applied Statistics by Robert G Root.
Abstract
* Statistics Activities for Psychology Majors by Ginger Holmes
Rowell.
Abstract.
* Don't neglect descriptive statistics in a first business
statistics class by Barry Schiller.
Abstract
* Using the Graphing Calculator to Enhance Conceptual Development in
Linear Regression by Murray H. Siegel.
Abstract
* Statistical Data on the Internet: Seek and Find! by Brian E Smith.
Abstract
* Statistics and Data: a Web-based Approach. by Brian E Smith.
Abstract
* When Statistics [for Elementary Teachers] Is Not A Full-Semester
Course by Mary M Sullivan.
Abstract
* Making Connections: Turning Students onto Learning Statistics by
Cathleen M Zucco-Teveloff.
Abstract
|
|
Amazon Best Selling Books in
Statistics |
|
Most Popular NEW Books in Statistics
Popularity:
Advanced Search: Subject = Science: Keyword = Statistics. Published
during 2012. Excludes new editions, Kindle editions and
non-books: game cards, calendars, Cliff notes, coloring books, GRE
workbooks.
#1
The Theory That Would Not Die: [Bayes' Rule] by Sharon B. McGrayne
#2 The Upside of Irrationality: Benefits of Defying Logic by Dan Ariely
#3 Scale Development: Theory and Applications by Robert F. DeVellis
#4 Algorithmic Puzzles by Anany Levitin and Maria Levitin
#5 Statistical Analysis: Microsoft Excel 2010 [Paperback] Conrad
Carlberg
#6 Statistics book Your Professor Doesn't Want You to Have S. Deviant
#7 Elementary Decision Theory by Herman Chernoff and Lincoln E. Moses
#8 Statistics for Spatio-Temporal Data by Noel Cressie and C.K.
Wikle
#9 Precision: Statistical-Mathematic Methods in Horse Racing. CX Wong
10 Statistical Abstract of the US, 2011-2012: by U.S. Dept Commerce
11 Futurecast: What Today's Trends Mean for Tomorrow's World. G Barna
12 Economic Indicators For Dummies by Michael Griffis
13
Understanding The New Statistics: Effect Sizes, etc. Geoff Cumming
14 Social Network Analysis: History, Theory and Methodology by C. Prell
15 Bayesian Population Analysis w WinBUGS by Marc Kery and M. Schaub
16 Statistics for the Behavioral Sciences by Gregory J. Privitera
17 Thinking Statistically by Uri Bram
18 Structural Equation Modeling with Mplus by Barbara M. Byrne
19 Uneducated Guesses: Uncover Misguided Education Policies. H Wainer
20 Econometrics by Example by Damodar N. Gujarati |
Most Popular books: Professional-Statistics
Popularity as of 12/2011:
Advanced Search: Science-Math, Keyword = Statistics.
Note: Ignores Kindle-only books, Kindle editions, free Creative Commmons
(CK-12) books and required "books" (c.f., My MathLab - Student Access).
#1
Outliers: The Story of Success by Malcolm Gladwell
#2 Diagnostic and Statistical Manual of Mental Disorders DSM-IV-TR. APA
#3 Scorecasting: The Hidden Influences by T Moskowitz and J.
Wertheim
#4 The Black Swan: The Impact of the Highly Improbable. Nassim Taleb
#5 Freakonomics by Steven D. Levitt and Stephen J. Dubner
#6 The Visual Display of Quantitative Information, 2nd ed. by Tufte.
#7 Moneyball: The Art of Winning an Unfair Game by Michael Lewis
#8 Research Design: Qualitative, Quantitative & Mixed Methods, Creswell
#9 Fifty Challenging Problems in Probability with Solutions by F.
Mosteller
10 Envisioning Information
by Edward R. Tufte.
11 The Visual Miscellaneum: Most Consequential Trivia by D McCandless
12 Understanding a Wager by Ramy Tadros
13 Math Jokes 4 Mathy Folks by G. Patrick Vennebush
14 How to Lie with Statistics by Darrell Huff and Irving Geis
15 Cartoon Guide
to Statistics by Larry Gonick, Woollcott Smith.
16 A Monetary History of the US, 1867-1960 by Friedman and Schwartz
17 Capitalism Hits the Fan: by Richard D. Wolff
18 Elementary Statistics (11th Edition) by Mario F. Triola
19 The End of Poverty: Economic Possibilities for Our Time by J. Sachs
20
Discovering Statistics Using SPSS by
Andy Field. |
|
Amazon Best Selling Books in
Statistics and Math |
|
Most Popular Science-Math Books: Statistics
12/2011 Popularity:
Adv. Search: Science-Math, Keyword = Statistics.
Note: Ignores Kindle-only books, Kindle editions, free Creative Commons
(CK-12) books and required "books" (c.f., My MathLab - Student Access).
#1 Outliers: The Story of Success by Malcolm Gladwell
#2 The Visual Display of Quantitative Information, 2nd ed. by Tufte.
#3
Research Design: Qualitative, Quantitative & Mixed Methods Creswell
#4 Fifty Challenging Problems in Probability with Solutions by F.
Mosteller
#5 Envisioning Information
by Edward R. Tufte.
#6 How to Lie with Statistics by Darrell Huff and Irving Geis.
#7 Cartoon Guide
to Statistics by Larry Gonick, Woollcott Smith.
#8 The Drunkard's Walk: How Randomness Rules Our Lives. L.
Mlodinow
#9
Discovering Statistics Using SPSS by
Andy Field.
10. Barron's AP Statistics by Martin Sternstein
11. The Theory That Would Not Die: [Bayes' Rule] by S. McGrayne
12. What is a p-value anyway? 34 Stories ... by Andrew Vickers
13. How to Measure Anything: Valuing Intangibles in Business, Hubbard
14. Probabilistic Graphical Models: Principles/Techniques.
Koller+Friedman
15. Fooled by Randomness:
The Hidden Role of Chance by Nassim Taleb.
16. Against the Gods: The Remarkable Story of Risk by Peter L. Bernstein
17. Visual Explanations: Images-Quantities, Evidence-Narrative. E Tufte
18. The Basic Practice of Statistics: w/Student CD by David S. Moore
19. Epidemiology: by Leon Gordis
20. Numbers Rule Your World: The Hidden Influence ... by Kaiser Fung |
"New and Popular"
Books: Mathematics
Amazon bestsellers (12/2012) in Books>Science & Math>
Mathematics. Sorted by "New &
Popular":
Excludes Kindle editions and non-books: game
cards, calendars, Cliff notes, coloring books, GRE/SAT/AP workbooks,
logic puzzles., Mathlab access, 2012
#1 The Signal and the Noise: Why Most Predictions Fail ...by Nate Silver
#2
Outliers: The Story of Success by Malcolm
Gladwell
#3 The Joy of x: A Guided Tour of Math, ... by Steven H. Strogatz
#4 Automate This: How Algorithms Came to Rule Our World by C. Steiner
#5 The Success Equation: Untangling Skill and Luck by M. Mauboussin
#5.The Visual Display of Quantitative Information, 2nd ed.,
by Tufte
#6a. Secrets of Mental Math: Mathemagician's Guide, Benjamin & Shermer
**********************
#6 The Success Equation: Untangling Skill and Luck ... by M Mauboussin
#7
Research Design: Qualitative, Quantitative
& Mixed Methods, Creswell
#8 Number Talks: Helping Children Build Mental Math ... K-5 by S.
Parrish
#9 The Fractalist: Memoir of a Scientific Maverick by Benoit Mandelbrot
10 ##
11
Math Doesn't Suck: How to Survive Middle
School Math .. by McKellar
12
Gödel, Escher, Bach: An Eternal Golden Braid by D. R. Hofstadter
13
Secrets of Mental Math: Mathemagician's
Guide... Benjamin & Shermer
14
Discovering Statistics Using SPSS by Andy Field
15 How to Measure Anything: ... the Value of Intangibles.. by Hubbard
16
Envisioning Information
by Edward R. Tufte.
17 The Art of R Programming: ...Statistical Software Design by Matloff
18 The (Honest) Truth About Dishonesty: How We Lie ... by Dan Ariely
19
Flatland: A Romance of Many Dimensions by Edwin A. Abbott
20 Show Me the Numbers: Designing Tables and Graphs ... by S Few
|
|
2011 AMAZON RANK:
STATISTICS TEXTBOOKS## |
|
Amazon.com US sales ranks
in books as of Dec 10, 2011. Sales-ranks:
100 sales/wk=4,000th;
60 /wk=10,000; 10/wk=100K;
1/wk=400K.
These rankings fluctuate daily and don't
include sales made directly by publishers to bookstores.
Rankings via www.salesrankexpress.com.
Rank Author: Title
6,437 Field:
Discovering Statistics Using SPSS 3rd
7,778 Gonick and Smith:
Cartoon Guide to Statistics 1st
9,456 Triola:
Elementary Statistics 11th
10,959 Rumsey:
Statistics for Dummies I 2nd
16,328 Moore:
The Basic Practice of Statistics 5th
17,698 Salkind:
Statistics for People Who (Think They) Hate Statistics 4
20,819 Gravetter
et al:
Essentials of Statistics
Behavioral Sciences 7th
21,091 Rumsey: Statistics for Dummies
II 1st
24,483
Larson and Farber:
Elementary Statistics: Picturing the World
4th
24,594 Bluman:
Elementary Statistics: A
Brief Version 5th
25.073
Hinders:
5 Steps to a 5 AP Statistics 2012-2013
26,389
Sullivan:
Fundamentals of Statistics
3rd
27,615
Triola:
Essentials of Statistics 4th
28,959 Bennett-Briggs:
Using & Understand Math: QR Approach 5th
31,209
Donnelly:
The Complete Idiot's Guide to Statistics 2nd
33,212 Urdan:
Statistics in Plain English
3rd
33,908
Wackerly, Mendenhall and Scheaffer. Mathematical Statistics 7th
33,964
Brussee
Statistics for Six Sigma Made Easy 1st
34,375
Agresti, Franklin:
Statistics:
Art/Science Learning from Data 2nd
34,901
Tabachnick and Fidell.
Using Multivariate Statistics 5th
36,316
Larson and Farber:
Elementary Statistics: Picturing the World 5th
39,154
Levine et al.,
Statistics for Managers using Excel 6th
39,305
Sullivan:
Statistics: Informed Decisions Using Data
3rd
40,945 Bluman:
Elementary Statistics: A Step By Step Approach 7th
43,424
Timothy Urdan:
Statistics in Plain English 3rd
46,157 Moore, McCabe, Craig:
Introduction to Practice of Statistics 6th
49,214 Moore and Notz:
Concepts and Controversies 7th
50,814 Freedman, Pisani and Purves:
Statistics 4th
58,769 COMAP:
For All Practical Purposes: Mathematical Literacy
... 8th
65,591
Bennett et al.,
Statistical Reasoning For Everyday Life
3
67,826 McClave, Sincich and Mendenhall:
Statistics
11th
77,272 Howell:
Fundamental Statistics for the Behavioral Sciences 7th
80.902 Brase and Brase:
Understandable Statistics 9th
83,867
Miller, Heeren and Hornsby:
Mathematical Ideas 12th
|
84,932 McClave
and Benson:
Statistics
for Business Economics 11th
85,757
Miller, Heeren and Hornsby:
Mathematical Ideas 11th
90,389
Nolan and Heinzen:
Statistics for the Behavioral Sciences 1st
91.736 Brase and Brase:
Understandable Statistics
10th ed.
92,421 Utts:
Seeing Through Statistics (3rd)
NovelRank
93,886
Agresti & Finlay:
Statistical Methods for Social Sciences 4th
95,713
Voelker, Orton and Adams:
Statistics (Cliffs Quick Review) (1st)
96,597
Hand:
Statistics -- A Very Short Introduction
97,204 Moore, McCabe et al
The Practice of Business Statistics 2nd
113,984
Witte and Witte:
Statistics
9th
129,884 Moore et al
The Practice of Statistics for Business/Econ 3rd
143,507 Burger and Starbird:
Heart of Mathematics (3rd)
195,988 Sprinthall:
Basic Statistical Analysis 8th
234,075
Pearson:
Statistical Persuasion:..Collect, Analyze, Present Data
298,672
Johnson:
Statistics: Principles and Methods
6th
300,030
Woloshin et al.
Know Your Chances: Understand Health Stat
300,156 Sevilla and Somers:
QR: Tools for Today's Citizen
1st
322,331 Utts and Heckard:
Mind on Statistics 3rd 770p.
353,666 Rossman, Chance:
Investigating Statistical Concepts ... 1st
430,814
Rossman et al
Workshop Statistics
with Data & Graph Calculator
451,274
Utts and Heckard:
Statistical Ideas and Methods 1st
464,814
Rossman-Chance:
Workshop Statistics:
Discovery with Data
523,659 Kiess, Green:
Statistical Concepts for Behavioral Sciences 4th
768,716 Langkamp and Hull:
QR and the Environment
1st
836,137 Bennett, Briggs:
Essentials of Using and Understanding Math
894,235 Greenleaf:
Quantitative Reasoning: Understand Nature
2nd
944,741
Aufmann and Lockwood:
Mathematical Thinking and QR
(1st)
1,290,838 Madison et al.,
Case Studies for QR: Media Articles 2nd.
1,465,983 Bennett and Briggs:
Themes of the Times on QL 4th
1,844,508
Fusaro, Kenschaft:
Environmental Math in the Classroom
1st
2,019,882 Jeffrey Bennett:
Math for Life 1st
2,165,582 Sons:
Mathematical Thinking & Quantitative
Reasoning 4th
2,337,671 Abramson and Isom:
Literacy
and Mathematics 1st
2,839,721 Richman et al:
Mathematics for Liberal Arts
2,912,304 Pierce, Wright, Roland:
Mathematics for Life: ... QL
6,838,550 Burkhart: Quantitative and Qualitative Reasoning Skills
******
Andersen, Swanson:
Understanding our Quantitative World
Not
ranked: Common Sense: Rethinking QR
No rank
Levine and Stephan.
Even You can Learn Statistics 2nd ed.
|
|
Top 25 StatLit
Papers by Google Scholar |
|
Google Scholar (Dec., 2012).
Search on "Statistical Literacy," all areas, exclude patents, summaries
only.
|
Rank |
Citations |
Description |
|
1 |
307 |
I. Gal (2002). Adults' statistical literacy: Meanings,
components, responsibilities. International Statistical Review. |
|
2 |
143 |
J Garfield (2002). The challenge of developing statistical
reasoning. Journal of Statistics Education. |
|
3 |
142 |
JM Watson (1997). Assessing statistical thinking using the
media. In The Assessment challenge in Statistics Education. |
|
4 |
135 |
B Chance (2002). Components of statistical thinking;
implications for instruction and assessment. Journal of
Statistics Education. |
|
5 |
131 |
KK Walman (1993). Enhancing statistical literacy:
Enriching our society. Journal of the American Statistical
Association. |
|
6 |
123 |
J Watson, R Callingham (2003). Statistical literacy: A
complex hierarchical construct. Statistics Education Research
Journal. |
|
7 |
120 |
JB Garfield (2003). Assessing statistical reasoning.
Statistics Education Research Journal. |
|
8 |
108 |
DJ Rumsey (2002). Statistical literacy as a goal
for introductory statistics courses. Journal of
Statistics Education. |
|
9 |
108 |
JM Watson, JB Moritz (2000). Developing concepts of
sampling. Jrnl
Mathematical Behavior |
|
10 |
80 |
D Ben-Zvi, et al. (2004). The challenge of developing
statistical literacy, reasoning, and thinking. [book] |
|
11 |
56 |
D. Ben-Zvi (2004). Statistical literacy, reasoning, and
thinking: Goals, definitions, and challenges. See 2004 book
[1] |
|
12 |
51 |
I Gal (2005). Statistical literacy. The Challenge of
developing statistical literacy |
|
13 |
48 |
S Lajoie (1998). Reflections on statistics: Learning, teaching,
and assessment in grades K-12. Book |
|
14 |
45 |
JM Watson, JB Moritz (2000). Development of understanding of
sampling for statistical literacy. Jrnl
Mathematical Behavior |
|
15 |
37 |
J Garfield et al, (2005). Research on statistical literacy,
reasoning, and thinking.... The challenge of developing
statistical literacy |
|
16 |
37 |
J Garfield (2005). A framework for teaching and assessing
reasoning about variablity. Statistics Education Research
Journal. |
|
17 |
36 |
J Watson (2005). Developing reasoning about samples. The
challenge of developing statistical literacy. |
|
18 |
32 |
S. Murray (2002). Preparing for diversity in statistics
literacy: Institutional-educational implications. Sixth
International Conference. |
|
19 |
30 |
I Gal (2003). Teaching for statistical literacy and
services of statistics agencies. The American Statistician, |
|
20 |
28 |
M. Schield (1999). Statistical literacy: Thinking
critically about statistics. APDU: Of Significance |
|
21 |
28 |
M. Schield (2004). Statistical literacy curriculum
design. IASE Curriculum Design Roundtable. |
|
22 |
25 |
R. Callingham, J. Watson (2005). Measuring statistical
literacy. Journal of Applied Measurement |
|
23 |
25 |
I. Gal (2002). Statistical literacy: Conceptual and
instructional issues. Perspectives on adults learning
mathematics |
|
24 |
25 |
I Gal (1995). Towards" probability literacy" for all
citizens: Building blocks and instructional dilemmas.
Exploring Probability in School |
|
25 |
23 |
I Gal (1995). Statistical Tools and Statistical
Literacy: The Case of the Average. Teaching Statistics. |
|
|
TOP
DOWNLOADS @ STATLIT.ORG |
|
Papers downloaded from
www.StatLit.org in 2012.
Total downloads: (246,00 in 2012; 198,000
in 2011; 207,000 in 2010; 184,000 in 2009; 106,000 in 2008).
Counts in parenthesis are (2012; 2011; 2010; 2009; 2008).
As of 2012, the StatLit website hosts 963 pdfs: 284 of slides, 679 of papers.
-
Percentage
Graphs in USA Today. Milo Schield 2006 ASA (17,819; 19,114; 11,179;
13,253; 14,247; 8,809) Inception-to-date:
84,896.
-
Presenting Confounding Graphically Using Standardization
(4,646; 1289; 2084; 1985; 1616).
Milo Schield, 2006 STATS magazine
-
Interpreting the substantive significance of multivariate
regression coefficients. Jane Miller 2008 ASA
(3,118; 1625[11]; 2094; 1412) -
Statistical
Literacy: A New Mission for Data Producers. Milo Schield 2011
SJIAOS (2,815 [10]; 1723) -
Coincidence in Runs and Clusters. Milo
Schield 2012 MAA (2,466[9])
[New in 2012] -
Exploring Simpson's Paradox. Larry Lesser (Univ. Texas, El Paso) NCTM
2001 (1,686[9]; 1143[9]; 2043[11]; 2844; 913)-
Statistics for Political Science
Majors. Gary Klass 2004 ASA (1,416[10]; 1389[10]; 596[6]; 765; 215) -
Ambiguity
Intolerance: An Impediment to Inferential Reasoning?
Robert Carver 2006 ASA (1,370 [11]; 1220; 624[5]; 797) -
Developing
statistical literacy with students and teachers in the secondary
mathematics classroom. Masters Thesis. Doyle (1,136[4]; 597[5]; 1811[9]) -
Importance and Measurement of
Pre-Service Teachers' Efficacy to Teach Statistics... 2009 ASA Harrell et al. (1,075[8]; 1753[11]; 2506) -
The
Reliability of Measuring Instruments. Thomas R. Knapp 2009. (1,027[7])
[Newly hosted in 2012]-
Teaching Statistical Literacy as Quantitative Rhetoric. ASA 2010
John Schmit 6up (986[8]; 1187[9];
279[2])
Number of months tracked in brackets [#] if less than 12. |
-
The Cult of Statistical
Significance by Stephen Ziliak and Deirdre McCloskey
2009 ASA 6up
4up (890[8]; 3160 3972; 999) -
Interpreting the Cumulative
Frequency Distribution of Socio-Economic Data. Othmar Winkler
2009 ASA [822[7], )
-
Social Mathematics in US Civics
Curriculum. James Mauch
dissertation 2005 (801[4]; 792[5]; 858[7]; 442; 470)
-
Interpreting
Socio-Economic Data Othmar Winkler 2011 ISI (793[5]) -
Matrixx Brief by
McCloskey and Ziliak 2009 (767[3]) -
Three Paradoxes.
Howard Wainer and Lisa Brown, Nat. Board of Med. Examiners. Draft
American Statistician 2004 (716[6]; 913[9]; 1084[10]; 315; 750)
-
Percentages by Thomas R.
Knapp 2009 (605[4])
[New in 2012]
-
Integrating Quantitative and
Financial Literacy. Joseph Ganem 2011 ASA (601[4])
-
Statistical Literacy: Thinking
Critically About Statistics. Milo Schield APDU 1999
(568[5])
-
Some Difficulties Learning
Histograms. Carl Lee & Maria Meletiou-Mavrotheris ASA 2003
(551[4]; 1156[8]; 1792; 991; 1179)
-
Statistical Literacy:
An Online Course
at Capella University. Marc Isaacson (Augsburg College) 2005 ASA
(512 [5], ???, 1054[10]; 902; 1202)
-
Teaching Statistical Literacy using
Odyssey2Sense (TM): A Unique Web-Forum by
Milo Schield
2011 MAA. 6up
Poster (496[3]; 558[4])
-
It May Be a Great Day for Baseball,
but Is It a Great Day for a Knuckleball? Robert H. Carver
2011 ASA (472[3]) 6up
-
Statistical Literacy Curriculum Design, 2004
Milo Schield IASE (457[2]
Excludes papers having fewer than 450 downloads. Excludes non-articles
such as Amazon lists, PowerPoint slides, reference documents (UTSQ-QEP.
Bracey principles, QR textbooks), pdf scans (1993 Weinberg)
and non-statistical articles (Freeminds).
|
|
TOP
PAGES VIEWED@STATLIT.ORG |
Top Pages Viewed at
www.StatLit.org in 2012
(####; ####; ###; ###): page views 2012; 2011, 2010; 2009; 2008.
-
Index (29,554; 28,157, 23,159; 15,729; 10,423): Home-
Standardizing (6,633; 5,176; 3,265; 2,434; 1,718): Excel
displays.
-
Joel Best
(4,617; 5,036; 4,794; 3,481; 3,118): Author
-
Howard Wainer (4,296; 3,893; 2,778; 2,127; 1,966):
Author. -
Adult Numeracy (4,070; 4,998, 5,007; 2,467; 1,987)
-
StatLit Papers
(3,073; 4,203; 3,131; 2,837; 2,444)
-
StatLit News 2011
(3,023)
-
StatLit News 2009
(2,797; 3,228; 4,869)
-
StatLit News 2008 (2,698; 2,975; 3,333; 2,634)
-
StatLit News 2010
(2,693; 2,963)
-
Gerd
Gigerenzer (2,283; 2,567; 1,993*; 1,415; 1,503):
Author -
Q/L Textbooks
(2,233; 3,159; 2,741; 2,484; 2,387)
-
StatLit News 2007 (1,940; 2,127; 2,552; 1,498; 1,928) -
Gerald
Bracey (1,923; 2,374; 2,655; 2,669; 2,035): Author-
Q/L Activities
(1,886; 2,106; 1,725*; 1,278; 1,378).
-
Q/L Books
(1,884; 2,305; 1,418; 1,459): Excluding textbooks -
StatLit
News 2012
(1,297[7]) New in 2012 -
StatLit
News 2004
(1,268[9]; 1,738; 1,929; 1,191; 1,183)
Total page views (including /GC):
(129,004). |
Page views as a percentage of Total:
Index (23%),
Standardizing (5%),
Joel Best (4%),
Howard Wainer (3%), Adult numeracy
(3%) and StatLit Papers (2.4%). All the rest were less
that 2.4% except "Other" (22%).
New pages in 2012: StatLit2012
(1,297[7]), Video1 (406[2])and Knapp (196[1]).
Note: Website statistics are tabulated by
the DeepMatrix program LiveStats® .XSP V8.03. Each month, the views
for the top 25 website pages are tabulated. Those pages that
aren't in the top 25 that month are treated as having zero views.
* Pages with less than 12 months
statistics are indicated by the asterisk (no adjustment). Pages with
less than 9 months of statistics are omitted (except those that are
student assigned during certain months).
In 2012, the StatLit web site has 61 htm pages in the main directory. Others include student-assigned pages (/GC) and the
Keck Survey.
Navigation page views (2012; 2011; 2010;
2009; 2008) totaled (10,203; 11,180; 9,716; 9,522; 8,474): Statistical
Literacy (2,616; 3,046; 2,729; 2,396; 2,100),
Statistical
Reasoning (2,081; 2,051; 1,617*; 1,625; 1,425),
StatLit News
(1,980*; 2,162; 1,836;
1,928; 1,863), Authors (1,578*; 2,245; 1,980; 2,033; 1,860), Numeracy (1,533*; 1,676*; 1,554*; 1,540; 1,226)
and Authors2 (415*[3]).
Student-assigned page-views
[all via /GC] were not totaled.
|
|
TOP
SITE SEARCH-PHRASES-2011## |
Top phrases in search referrals to
www.StatLit.org.
Search referrals (2012; 11; 10; 09; 08; 07) References
shown are likely targets.
Search phrase totals (7,419; 14,022; 21,110)
-
Joel Best (238; 835; 1,147; 594):
See Joel Best author page. [Billie
Joel?]
-
graphs (171; 567; 654; 634): Schield
Percentage Graphs in USA Today
-
Howard Wainer (137; 424;340; 110): See
Howard Wainer
page.
-
Statistical Literacy
(237; 341; 385; 249): See Statistical Literacy.
Includes "StatLit"
-
Quantity words (317; 547; 264): Schield, Why
Students Use 'Many'?
-
Data (111; 80)
-
Standardiz... (110; 240; 100; 131):
Schield, Adjusting for
Confounding Graphically.
-
Significance, substantial and statistical (110*; 168)
|
-
Numeracy and Math across curriculum
(57*; 197; 75; 60): See Numeracy
-
Gerd Gigerenzer (44*; xxx)
-
quantitative reasoning (28*; 22; 33):
See Numeracy or Q/L -
Simpson Paradox
(19*; 45; 59; 54): Schield, "Adjust for
Confounding Graphically".
-
Social construction and ambiguity (13*; 38): See
Schield, Teaching the Social
Construction of Statistics
-
Gerald Bracey (13*; 214; 94): See
Gerald Bracey author page.
Each month, LiveStats ranks the search
terms used and captures the top 20 with the associated number of
referrals. In 2011, this generated over a hundred unique
search terms with 1,851
visits (plus 5,568 Other) for a total of 7,419 total search
referrals. These search terms were grouped by search phrase
(so 'standardizing' and 'standardized' were counted together) into
45 groups. Note that these numbers are very sensitive to
how search terms are grouped into search phrases. Note that
most of the search
referrals are tabulated under Other.
|
|
GOOGLE SITE RANKINGS |
|
2012: Google & Yahoo rate www.StatLit.org as the #2 site for Statistical Literacy
[after Wikipedia] for the first year after seven years as #1.
When two words are hyphenated, they
are searched as a phrase.
#1: Othmar Winkler,
statistical prevarication, percentage graphs.
#2: Statistical literacy, Howard
Wainer,
David Phyllis Whitin, chance
grammar,
Jane-Miller statistics.
Top 5:
standardizing (3), percentage grammar (3), statistical doublespeak
(3),
, Lynn Steen (3), Milo
Schield (3), Joel Best (4).
Top 10:
, USA Today graphs (6), Marc-Isaacson statistics (6),
Dennis Haack (7), Gerd Gigerenzer (7), Gerald
Bracey (8), John Paulos (8),
adult numeracy (9).
|
Top 30: statistical illiteracy (11), social construction statistics (12), statistically literate (12), multivariate thinking (18),
and
statistical
reasoning (25).
This site was not in the first 30 for chance, Bernie Madison, confound,
confounded, confounder. confounding, critical thinking, effect size, financial literacy, graphs, health literacy, health numeracy, induction,
information literacy, innumeracy, interaction,
Jane Watson, journalistic
significance, Katherine Wallman,
numeracy, quantitative literacy, quantitative
reasoning, quantity words, randomness, significance,
Simpson's paradox, social construction, spurious, standardization,
statistical education, statistically illiterate, statistics
or Take care.
Process: Search on phrase (in quotes); Find first instance of
statlit.org or Augsburg.edu/ppages/~schield [except for Milo Schield].
|
|
TOP 10 REFERRAL DOMAINS-2011## |
|
Visits by Referral Domain.
Data (2011; 2010). Total (46,742; 61,557) Other (9,933; 8,563)
#0: www.dailyspeculations.com
[linked to a picture] (857; 11,393)
#1:
www.google.com (12,693; 10,510)
#2: ilt.ilstu.edu or
pol.illinoisstate.edu (10,761; 8,563)
#3: www.google.co.uk
(1,488; 1,263)
#4: www.google.co.in
(1,342; 1,040)
|
#5:
www.bing.com (1,173; 1,056)
1,165
#6:
www.google.ca (1,023; 833)
#7: www.analyticbridge.com
(920, xxx)
#8: search.yahoo.com
(792; 724)
#9 www.google.com.au
(702; 600)
#10: scienceCampaign.org.uk (442, xxx)
To do: Chance magazine. Domains, Textbooks
Rank, Amazon Best selling.
|
|