|
2005 Stat Lit News:
Get concise
updates on what is happening. One to two e-mails per year. Easy
opt-out option; no passwords. No other member sees your name or address.
803 members. See 2004 Stat Lit
News. For more stories, see
www.INNUMERACY.com.
|
|
|
Statistical Literacy 2005 |
|
|
|
|
 April
1, 2005: Capella University offers
Statistical Literacy (MAT 2050) on-line under "Mathematical and Logical
Reasoning." "This course concentrates on the application of
critical thinking skills to arguments involving statistics. Emphasis is
placed on the learner as a consumer of statistics rather than a producer
of statistical calculations. Course activities focus on the
interpretation ...of real-world situations and news stories." See
detailed review
by course designer Marc Isaacson. April
1, 2005: Capella University offers
Statistical Literacy (MAT 2050) on-line under "Mathematical and Logical
Reasoning." "This course concentrates on the application of
critical thinking skills to arguments involving statistics. Emphasis is
placed on the learner as a consumer of statistics rather than a producer
of statistical calculations. Course activities focus on the
interpretation ...of real-world situations and news stories." See
detailed review
by course designer Marc Isaacson. |
 Paul Rosenbaum's
classic Observational Studies is out in an expanded 2nd edition. This book is
a great reference.
According to Tom Love,
"This book is
about half again as long, and has new chapters on
non-additive models for treatment effects, and on planning observational
studies. It also has lots of newer methods described. I
think it's a substantial leap forward over the 1995 text." Paul Rosenbaum's
classic Observational Studies is out in an expanded 2nd edition. This book is
a great reference.
According to Tom Love,
"This book is
about half again as long, and has new chapters on
non-additive models for treatment effects, and on planning observational
studies. It also has lots of newer methods described. I
think it's a substantial leap forward over the 1995 text." |
|
|
|
|
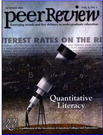 Tony Griffith, Math Instructor,
Westminster School. Online Feedback. I agree with the premise [of QL], but
..I teach high school math at a prep school.... Does the
admissions office at Amherst prefer a kid who can discuss Simpson's
Paradox or simplify a rational function? Does the SAT 2 reward a kid
who can understand Arrow's Impossibility Theorem or factor a cubic
function? Tony Griffith, Math Instructor,
Westminster School. Online Feedback. I agree with the premise [of QL], but
..I teach high school math at a prep school.... Does the
admissions office at Amherst prefer a kid who can discuss Simpson's
Paradox or simplify a rational function? Does the SAT 2 reward a kid
who can understand Arrow's Impossibility Theorem or factor a cubic
function? |
 Carol
Geary Schneider, president AAC&U. "No one course of study can realistically develop all the
major kinds of quantitative literacies." "It is
malpractice to allow students to
slip through college without developing the ability to use quantitative
strategies to examine significant questions."
We are shortchanging our graduates with the
demands of a numbers-infused world. Carol
Geary Schneider, president AAC&U. "No one course of study can realistically develop all the
major kinds of quantitative literacies." "It is
malpractice to allow students to
slip through college without developing the ability to use quantitative
strategies to examine significant questions."
We are shortchanging our graduates with the
demands of a numbers-infused world. |
|
|
|
|
 An on-line survey
has been developed on reading basic tables of percentages. Respondents
receive
immediate feedback. This simple survey is an
eye-opener. Less than 25% answer all five questions
correctly. Test your students. See how many they get right.
Paper version An on-line survey
has been developed on reading basic tables of percentages. Respondents
receive
immediate feedback. This simple survey is an
eye-opener. Less than 25% answer all five questions
correctly. Test your students. See how many they get right.
Paper version |
 Milo
Schield participated in
an invited panel
organized by IASE President Chris Wild at the 2005 ISI on the future of
statistical education.
In a background paper, Milo argued that statistical educators spend too
much effort ministering to "believers" by teaching traditional
statistics and not enough effort converting "non-believers" into
"believers" by teaching statistical literacy. Milo
Schield participated in
an invited panel
organized by IASE President Chris Wild at the 2005 ISI on the future of
statistical education.
In a background paper, Milo argued that statistical educators spend too
much effort ministering to "believers" by teaching traditional
statistics and not enough effort converting "non-believers" into
"believers" by teaching statistical literacy. |
|
|
From Statistical Significance to Effect Estimation [Added
6/2012]
|
|
Statistical Literacy Training • Regional courses to train 12 trainers
for each country and provide support and seed funding to train 100-200
in country users • Training will cover : MDG indicators ; Sources,
methods and meta data ; Accessing data through the central repository ;
Basic statistical analysis ; Analysis of data for improving monitoring,
evaluation, advocacy and policy development.
6up Handout |
 Fiona
Fidler (La
Trobe University in Melbourne Australia) authored "From Statistical
Significance to Effect Estimation: Statistical Reform in Psychology,
Medicine and Ecology." As noted on her personal website,
"Statistical reform involves a move away from over-reliance on
statistical significance testing and dichotomous decisions made on the
basis of p values to effect size estimation, confidence intervals,
Bayesian techniques and other methods." Fiona
Fidler (La
Trobe University in Melbourne Australia) authored "From Statistical
Significance to Effect Estimation: Statistical Reform in Psychology,
Medicine and Ecology." As noted on her personal website,
"Statistical reform involves a move away from over-reliance on
statistical significance testing and dichotomous decisions made on the
basis of p values to effect size estimation, confidence intervals,
Bayesian techniques and other methods." |
|
Statistical Literacy: IASSIST
International Association for Social Science Information Service &
Technology |
|
|
|
|
 "IASSIST
has a significant role to play in helping nurture new
generations of data service providers who can help build a persistent
culture of statistically-literate students, researchers and
professionals. And may this wave of commitment to and
enthusiasm for the cause of statistical literacy thrive!’!’"
Wendy Watkins (right) and Louise Corti (far right). "IASSIST
has a significant role to play in helping nurture new
generations of data service providers who can help build a persistent
culture of statistically-literate students, researchers and
professionals. And may this wave of commitment to and
enthusiasm for the cause of statistical literacy thrive!’!’"
Wendy Watkins (right) and Louise Corti (far right). |
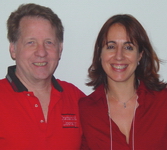 Milo
Schield, Augsburg College, (shown with Louise Corti, IASSIST
Europe) argues that librarians interested in information literacy and data librarians interested in
data literacy should consider teaching statistical literacy since all
three involve critical thinking and since many social science arguments
involve statistics. Milo
Schield, Augsburg College, (shown with Louise Corti, IASSIST
Europe) argues that librarians interested in information literacy and data librarians interested in
data literacy should consider teaching statistical literacy since all
three involve critical thinking and since many social science arguments
involve statistics. |
|
|
|
|
Ann Gray noted that "statistical literacy is necessary
to interprete the information that is provided in order to determine if
the statistic is right for a specific purpose or application."
She argued that "library schools should teach statistical literacy.
Librarians need to know to make assessments of quality and utility..." |
Louse Corti (above), UK Data Archive at Colchester
Essex, presented the Survey Data in Teaching Project (SDiT): Enhancing
Critical Thinking and Data Literacy. Project goal:
"improving the data literacy of ... students to:
enable a better understanding of the use of social science data... and
become critical consumers of these data. |
|
Numeracy |
Epidemiology |
|
|
|
|
 At Numeracy and Beyond,
Part II,
Dick Scheaffer, past-president of ASA,
argued that "statistics can serve as one important (perhaps
essential) vehicle for effecting improvements in the teaching of QL."
Project Overview
and Goal: To see "what
level of numeracy might be required of average citizens..."
"to identify [fundamental] principles ... which could guide
teaching."
 |
 "The
YES Competition offers college scholarship awards to high school juniors
and seniors who conduct outstanding research projects that apply
epidemiological methods of analysis to a health-related issue. David
Fraser (past President Swarthmore) views "Epidemiology
as a liberal art" and presents an "Intellectual
Framework." Teaching
units include Confounding (10),
Observational Studies & Bias in Epidemiology (19), Measures in Epidemiology (9) and Attributable Risk Applications (17). "The
YES Competition offers college scholarship awards to high school juniors
and seniors who conduct outstanding research projects that apply
epidemiological methods of analysis to a health-related issue. David
Fraser (past President Swarthmore) views "Epidemiology
as a liberal art" and presents an "Intellectual
Framework." Teaching
units include Confounding (10),
Observational Studies & Bias in Epidemiology (19), Measures in Epidemiology (9) and Attributable Risk Applications (17).
|
|
MAA Quantitative Literacy Workshop |
|
|
|
|
 Host
David Bressoud, Macalester College. In his keynote, "Core Concepts in QL", Milo Schield argued that QL must have core
concepts "that non-math faculty can understand easily, use regularly and
teach effectively." Notes
& 6up slides.
Bernie Madison expressed concern in making QL a formal discipline. Host
David Bressoud, Macalester College. In his keynote, "Core Concepts in QL", Milo Schield argued that QL must have core
concepts "that non-math faculty can understand easily, use regularly and
teach effectively." Notes
& 6up slides.
Bernie Madison expressed concern in making QL a formal discipline.
|
 Danny
Kaplan, Macalester College, reviewed using everyday news stories in a
Quantitative Methods for Public Policy course . Policy
Topics: Response to Global Warming, Mad Cow Disease, Immigration and
Taxes. Quantitative topics that span policy topics: rates,
growth, trade-offs, detection and sampling. Average vs
Marginal Rates. Danny
Kaplan, Macalester College, reviewed using everyday news stories in a
Quantitative Methods for Public Policy course . Policy
Topics: Response to Global Warming, Mad Cow Disease, Immigration and
Taxes. Quantitative topics that span policy topics: rates,
growth, trade-offs, detection and sampling. Average vs
Marginal Rates. |
|
National Numeracy Network |
|
|
|
|
 Bernie
Madison, University of Arkansas, is teaching a unique QL course,
"News Math," based on articles in the everyday news. Topics:
Measurement & number sense, Rates of change, Probability and Statistics.
Lessons: Using Numbers, Percent and Percent Change, Linear and
Exponential Growth, Indices and Condensed Measures, Graphical
Interpretation and Production, Counting, Odds, Risk, Geometric
Measurement and Weather Forecasting.
Syllabus. Bernie
Madison, University of Arkansas, is teaching a unique QL course,
"News Math," based on articles in the everyday news. Topics:
Measurement & number sense, Rates of change, Probability and Statistics.
Lessons: Using Numbers, Percent and Percent Change, Linear and
Exponential Growth, Indices and Condensed Measures, Graphical
Interpretation and Production, Counting, Odds, Risk, Geometric
Measurement and Weather Forecasting.
Syllabus. |
 Bernie
Madison, noted that the National Numeracy Network
and the SIGMAA QL Bernie
Madison, noted that the National Numeracy Network
and the SIGMAA QL
"have missions that are integral parts of a growing
national effort to make Americans more able to deal with the multitude
of quantitative issues that confront them in their daily lives as
citizens, consumers, and workers." |
|
MAA: Numeracy and SIG QL 2005 |
|
|
|
|
 Bernie Madison
(5 Jan): Talk at MAA. This combination of word and number is
deadly! Check your math majors at the ends of their careers, check your
graduate students, check your colleagues.... See "What
is a Course in QL?" "Methods learned vanish rather
quickly." Bernie Madison
(5 Jan): Talk at MAA. This combination of word and number is
deadly! Check your math majors at the ends of their careers, check your
graduate students, check your colleagues.... See "What
is a Course in QL?" "Methods learned vanish rather
quickly." |
Bernie Madison (7 Jan) from talk at MAASIG
QL: "even modified traditional math courses will
not suffice to achieve quantitative literacy in our students..." "...It’s going to require much
closer connections to world conditions that dictate what QL is."
"Nobody can achieve quantitative literacy with just a course..."
"Courses and textbooks tend to promote the degeneration to
methodology." |
|
Quantitative Reasoning (ACM) |
Carleton
hosts QR Workshop for ACM
10/2005
Strengthening Quantitative Reasoning |
|
|
 Carleton
Dean, Scott Bierman, hosted the two-day Associated Colleges of the
Midwest (ACM) workshop. He introduced speakers Joel Best (author
of Damned Lies and Statistics) and Bill Seagraves (Associate Dean
of Yale College). He reviewed data obtained in the use of
quantitative measures in
student portfolios.
QR at ACM colleges. Download
Seagraves' PPT. Carleton
Dean, Scott Bierman, hosted the two-day Associated Colleges of the
Midwest (ACM) workshop. He introduced speakers Joel Best (author
of Damned Lies and Statistics) and Bill Seagraves (Associate Dean
of Yale College). He reviewed data obtained in the use of
quantitative measures in
student portfolios.
QR at ACM colleges. Download
Seagraves' PPT. |
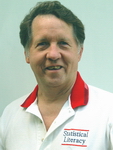 Milo
Schield, Augsburg College, analyzed some 500 words that involve quantity
without specifying a number. E.g., many, most, few and some.
Schield argued that students avoid using more precise measures (rates
and percentages) because they did not know how to describe or compare rates
and percentages. Includes Schield's 2004 list of the
top 25 books on Statistical Literacy. Milo
Schield, Augsburg College, analyzed some 500 words that involve quantity
without specifying a number. E.g., many, most, few and some.
Schield argued that students avoid using more precise measures (rates
and percentages) because they did not know how to describe or compare rates
and percentages. Includes Schield's 2004 list of the
top 25 books on Statistical Literacy. |
|
ISI 2005 |
|
|
|
|
 Chris
Wild (New Zealand) organized a panel on the topic of "Statistics for
Life: What statistical ideas or wkills matter most, and why?"
Speakers included Denise Lievesley (ISI President 2007-2009),
Stephen Stigler (ISI President 2003-2005) and Niels Keiding (ISI
President 2005 - 2007), Nick Fisher (ISI Vice President 2003-2005) and
Milo Schield. Speakers were asked to be provacative, over-the-top
in making predictions about the future of statistical education. Chris
Wild (New Zealand) organized a panel on the topic of "Statistics for
Life: What statistical ideas or wkills matter most, and why?"
Speakers included Denise Lievesley (ISI President 2007-2009),
Stephen Stigler (ISI President 2003-2005) and Niels Keiding (ISI
President 2005 - 2007), Nick Fisher (ISI Vice President 2003-2005) and
Milo Schield. Speakers were asked to be provacative, over-the-top
in making predictions about the future of statistical education. |
 Denise
Lievesley (UNESCO) noted that "No modern society can function
meaningfully as a democracy if the electorate remains statistically
illiterate." Essential skills: "Are useful in multiple life
contexts; Are associated with social, economic , educational and health
outcomes; Can be learned and taught; and Improve individual’s ability to
adapt to change and to shape their environment." "Numeracy is the
knowledge and skills required to effectively manage and respond to the
mathematical demands of diverse situations." Denise
Lievesley (UNESCO) noted that "No modern society can function
meaningfully as a democracy if the electorate remains statistically
illiterate." Essential skills: "Are useful in multiple life
contexts; Are associated with social, economic , educational and health
outcomes; Can be learned and taught; and Improve individual’s ability to
adapt to change and to shape their environment." "Numeracy is the
knowledge and skills required to effectively manage and respond to the
mathematical demands of diverse situations." |
|
|
|
|
 Milo
predicted that 2005 would be the high point for the prevalence of
statisticians in MBA programs and for statistics in business programs.
6up Milo referenced this
paper: Statistical Literacy: An
Evangelical calling for Statistical Educators.
6up slides. If statistical
educators are to serve the quantitative needs of these students, they
must be evangelists to non-believers rather than being ministers to
believers; they must focus on statistical literacy rather on statistical
competence. Milo
predicted that 2005 would be the high point for the prevalence of
statisticians in MBA programs and for statistics in business programs.
6up Milo referenced this
paper: Statistical Literacy: An
Evangelical calling for Statistical Educators.
6up slides. If statistical
educators are to serve the quantitative needs of these students, they
must be evangelists to non-believers rather than being ministers to
believers; they must focus on statistical literacy rather on statistical
competence. |
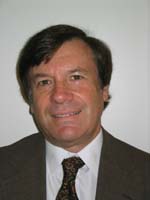 Nick
Fisher (ValueMetrics Australia) argued that managing uncertainty
involves: Understand basic statistical graphics and how they can be
misused. Appreciating that statistical numbers ... aren’t really
as precise as they appear. Being conscious of the possibilities of
biases … Realising that reliable data can be obtained by surveying
a relatively tiny fraction of population. Realising that apparent
differences between two averages may not be real. Nick
Fisher (ValueMetrics Australia) argued that managing uncertainty
involves: Understand basic statistical graphics and how they can be
misused. Appreciating that statistical numbers ... aren’t really
as precise as they appear. Being conscious of the possibilities of
biases … Realising that reliable data can be obtained by surveying
a relatively tiny fraction of population. Realising that apparent
differences between two averages may not be real. |
|
|
|
|
 Enriqueta
D. Reston (Univ. of San Carlos,) investigated the statistical literacy
of 56 graduate students using a 15 item scale. Statistical
literacy was measured at two levels: (1) understanding basic statistical
concepts, and (2) ability to understand and follow claims and arguments
based on data and graphs presented in newspapers and research reports.
students performed relatively poorly in the 15- point scale (mean =6.93;
SD=2.39; range=12-2). For the students, their relatively poor
performance was an “ eye-opener“. Further, it has served as a motivation
for them to own the goal of developing statistical literacy. Enriqueta
D. Reston (Univ. of San Carlos,) investigated the statistical literacy
of 56 graduate students using a 15 item scale. Statistical
literacy was measured at two levels: (1) understanding basic statistical
concepts, and (2) ability to understand and follow claims and arguments
based on data and graphs presented in newspapers and research reports.
students performed relatively poorly in the 15- point scale (mean =6.93;
SD=2.39; range=12-2). For the students, their relatively poor
performance was an “ eye-opener“. Further, it has served as a motivation
for them to own the goal of developing statistical literacy. |
 Fredrich
Ho presented The Role of Official Statistics
Agencies in the Promotion of Statistical Literacy Among Students.
"It is essential for every citizen to possess an adequate understanding
of statistical concepts and methodologies and commonly available
statistical data. Official statistics agencies are well placed to
contribute to the promotion of the statistical knowledge of their
communities. This is also a natural task for them too since it is in
their own interest to ensure that the statistical data they produce are
widely and properly used." Fredrich
Ho presented The Role of Official Statistics
Agencies in the Promotion of Statistical Literacy Among Students.
"It is essential for every citizen to possess an adequate understanding
of statistical concepts and methodologies and commonly available
statistical data. Official statistics agencies are well placed to
contribute to the promotion of the statistical knowledge of their
communities. This is also a natural task for them too since it is in
their own interest to ensure that the statistical data they produce are
widely and properly used." |
|
IASE Statistical Education 2005 |
|
|
Swinburne Uni: A Leader in Report Writing
4/2005 |
|
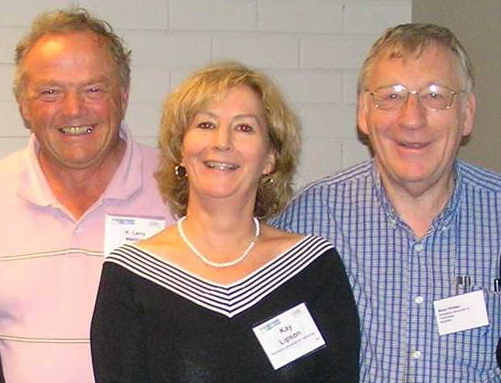 The
IASE hosted a conference in Sydney April 2005 on "Statistical
Education and the Communication of Statistics. Kay Lipson
(center) and Brian Phillips (right) were co-chairs. Larry Weldon
(left) edited the
proceedings. Many excellent papers. Check them out. The
IASE hosted a conference in Sydney April 2005 on "Statistical
Education and the Communication of Statistics. Kay Lipson
(center) and Brian Phillips (right) were co-chairs. Larry Weldon
(left) edited the
proceedings. Many excellent papers. Check them out. |
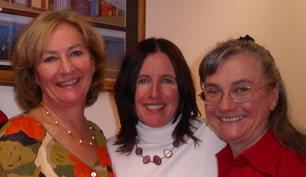 Kay
Lipson (left) and Sue Kokonis (center) talked on "Introducing
Report Writing into Introductory Statistics." Kay
Lipson (left) and Sue Kokonis (center) talked on "Introducing
Report Writing into Introductory Statistics."
Glenda Francis
(right) talked on "An
Approach to Report Writing." |
|
|
|
|
 K.
Larry Weldon, Canada, proposed that those who design curricula
for early statistics courses should "provide a serious introduction to
graphical data analysis, at the expense of some traditional parametric
inference." In "Statistics
and the Media" Wayne Smith discussed "educating
journalists and statisticians to tell the story behind the numbers." K.
Larry Weldon, Canada, proposed that those who design curricula
for early statistics courses should "provide a serious introduction to
graphical data analysis, at the expense of some traditional parametric
inference." In "Statistics
and the Media" Wayne Smith discussed "educating
journalists and statisticians to tell the story behind the numbers."
|
 Milo
Schield, Augsburg College US, presented a paper on "Statistical
Prevarication: Telling Half-Truths Using Statistics." Milo presented
examples of statistical prevarication in the daily news. He then
argued that statistical prevarication is at least as common in intro statistics
texts and classes as in the daily news. Milo presented examples of
prevarication involving statistical inference. Milo
Schield, Augsburg College US, presented a paper on "Statistical
Prevarication: Telling Half-Truths Using Statistics." Milo presented
examples of statistical prevarication in the daily news. He then
argued that statistical prevarication is at least as common in intro statistics
texts and classes as in the daily news. Milo presented examples of
prevarication involving statistical inference. |
Inference by Eye: Confidence Intervals
11/2012 |
|
|
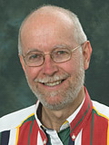 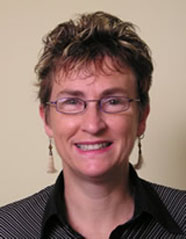 Cumming,
G. (left) , & Finch, S. (right). Inference by eye: Confidence intervals,
and how to read pictures of data.
American Psychologist, 60,
170-180. "For 95% confidence intervals and two independent means:
p £.05 when the bottom of one 95% confidence
interval overlaps the top of the other by about 50 percent." Cumming,
G. (left) , & Finch, S. (right). Inference by eye: Confidence intervals,
and how to read pictures of data.
American Psychologist, 60,
170-180. "For 95% confidence intervals and two independent means:
p £.05 when the bottom of one 95% confidence
interval overlaps the top of the other by about 50 percent." |
 Geoff
Cumming (far left) and Fiona Fiddler (right) highlighted an important
finding: "For repeated measure
designs, interval estimates around individual means provide no direct
information about the statistical significance of the difference. Only
11% of participants demonstrated recognition of this, and indicated that
the task could therefore not be completed." For follow-on, see
Judging statistical significance from the overlap of confidence
intervals Geoff
Cumming (far left) and Fiona Fiddler (right) highlighted an important
finding: "For repeated measure
designs, interval estimates around individual means provide no direct
information about the statistical significance of the difference. Only
11% of participants demonstrated recognition of this, and indicated that
the task could therefore not be completed." For follow-on, see
Judging statistical significance from the overlap of confidence
intervals |
|
ASA Statistical Education |
|
|
|
|
 Jerry
Moreno's goal: "to produce liberal arts students who are
able ... to read a newspaper more intelligently." "We cannot afford to offer two intro courses." "Our
task is to define a few basic core statistics concepts ...and then build one course around those core concepts."
See also his article, "Statistics
as a Core Course in Liberal Arts" in
MAA's
Innovations in Teaching Statistics.
Review. Jerry
Moreno's goal: "to produce liberal arts students who are
able ... to read a newspaper more intelligently." "We cannot afford to offer two intro courses." "Our
task is to define a few basic core statistics concepts ...and then build one course around those core concepts."
See also his article, "Statistics
as a Core Course in Liberal Arts" in
MAA's
Innovations in Teaching Statistics.
Review.
|
 John McKenzie,
Babson College, reported on core concepts: Variability (96%), Association-causation (82%),
Randomness (77%), Significance: practical / statistical (77%), Data collection (75%),
Sampling
distributions (71%) and Hypothesis tests (64%). John classified
courses as "statistical
literacy-reasoning-thinking" (concepts), applied stats (applications,
service) & math. statistics (theory). John McKenzie,
Babson College, reported on core concepts: Variability (96%), Association-causation (82%),
Randomness (77%), Significance: practical / statistical (77%), Data collection (75%),
Sampling
distributions (71%) and Hypothesis tests (64%). John classified
courses as "statistical
literacy-reasoning-thinking" (concepts), applied stats (applications,
service) & math. statistics (theory). |
|
Statistical Literacy Session,
ASA 2005 |
Statistical
Literacy 2005 8/2005
|
Crime Scene Investigators & Stat. Literacy 8/2005 |
|
 The
8th annual session on Statistical Literacy was hosted by Milo Schield at
the ASA meeting in Minneapolis. Speakers included Lewis Cope
(left, Jane Miller (right), Marc Isaacson (below), Chris Olsen (lower
right), and Tom Burnham (below Isaacson). Some 90 people attended
the session. Lewis gave an animated presentation titled
"Toys,
Tales and a Journalist's View of Statistics" The
8th annual session on Statistical Literacy was hosted by Milo Schield at
the ASA meeting in Minneapolis. Speakers included Lewis Cope
(left, Jane Miller (right), Marc Isaacson (below), Chris Olsen (lower
right), and Tom Burnham (below Isaacson). Some 90 people attended
the session. Lewis gave an animated presentation titled
"Toys,
Tales and a Journalist's View of Statistics" |
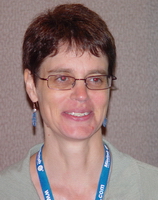 Jane Miller, Rutgers University, presented a paper "What Can 'CSI' Teach
Us about Statistical Literacy?" Jane is the author of "The
Chicago Guide to Writing about Numbers" (See StatLit 2004) and "The Chicago Guide
to Writing about Multivariate Analysis." Jane notes that
"writing about multivariate analyses is a surprisingly common task." "A terrific book" James Trussell Jane Miller, Rutgers University, presented a paper "What Can 'CSI' Teach
Us about Statistical Literacy?" Jane is the author of "The
Chicago Guide to Writing about Numbers" (See StatLit 2004) and "The Chicago Guide
to Writing about Multivariate Analysis." Jane notes that
"writing about multivariate analyses is a surprisingly common task." "A terrific book" James Trussell |
|
|
|
|
 Marc
Isaacson, Augsburg College, reviewed the Statistical Literacy course
first offered by Capella University in April 2005 using Schield's Statistical Literacy
textbook. Students found this course "very demanding" but "very
satisfying." They ranked this course 2nd among their 15 Gen Ed
courses in challenging students to think
critically about the subject matter. Marc
Isaacson, Augsburg College, reviewed the Statistical Literacy course
first offered by Capella University in April 2005 using Schield's Statistical Literacy
textbook. Students found this course "very demanding" but "very
satisfying." They ranked this course 2nd among their 15 Gen Ed
courses in challenging students to think
critically about the subject matter. |
 Chris
Olson, Cedar Rapids Community Schools, presented a paper, "Epidemiology
as a Context for Teaching Confounding in Introductory Statistics." "surely the most needed
discussion about everyday inference is about what is probably the
greatest source of inferential error – the confusion of correlation with
causation, as well as a general ignorance of ... confounding." Chris
Olson, Cedar Rapids Community Schools, presented a paper, "Epidemiology
as a Context for Teaching Confounding in Introductory Statistics." "surely the most needed
discussion about everyday inference is about what is probably the
greatest source of inferential error – the confusion of correlation with
causation, as well as a general ignorance of ... confounding."
|
|
|
|
|
 Tom
Burnham, Cognitive Consulting, presented a paper titled "An
Online Program for Decoding Ordinary English Descriptions and
Comparisons of Percentages and Rates." This
on-line program gives
immediate feedback on the use of ordinary English to describe & compare
ratios presented in tables. Students found this program quite
helpful. Try it and see.
General Introduction. Tom
Burnham, Cognitive Consulting, presented a paper titled "An
Online Program for Decoding Ordinary English Descriptions and
Comparisons of Percentages and Rates." This
on-line program gives
immediate feedback on the use of ordinary English to describe & compare
ratios presented in tables. Students found this program quite
helpful. Try it and see.
General Introduction. |
 Milo
Schield, Director of the W. M. Keck Statistical Literacy project at
Augsburg College, reviewed the prevalence
of chance-related terms on the web and used these prevalences to
identify those topics that should be part of a general statistical
literacy course. Includes unusual topics such as evolution, ESP and a
Bayesian approach to statistical significance. Milo
Schield, Director of the W. M. Keck Statistical Literacy project at
Augsburg College, reviewed the prevalence
of chance-related terms on the web and used these prevalences to
identify those topics that should be part of a general statistical
literacy course. Includes unusual topics such as evolution, ESP and a
Bayesian approach to statistical significance. |
|
2005 StatLit Website Statistics |
|
StatLit Site
(During 2005*)
45,208 Visits,
47,727 Page Views,
29,568 Downloads,
1,419 Hours Spent,
9.0 GB Bandwidth,
576,368 Hits |
Home Page
Views*:
4,189 - 2005,
1,231 - 2004,
1,200 - 2003,
1,056 - 2002. * Years: 11/01 - 10/30
Peak Daily Traffic:473 visits, 10,667 hits,
2 December, 2005 |


 Paul Rosenbaum's
classic Observational Studies is out in an expanded 2nd edition. This book is
a great reference.
  Tony Griffith, Math Instructor,
Westminster School. Online Feedback. I agree with the premise [of QL], but
..I teach high school math at a prep school.... Does the
admissions office at Amherst prefer a kid who can discuss Simpson's
Paradox or simplify a rational function? Does the SAT 2 reward a kid
who can understand Arrow's Impossibility Theorem or factor a cubic
function?
 Milo
Schield participated in
 Fiona
Fidler (
 "IASSIST
has a significant role to play in helping nurture new
generations of data service providers who can help build a persistent
culture of statistically-literate students, researchers and
professionals. And may this wave of commitment to and
enthusiasm for the cause of statistical literacy thrive!’!’"
Wendy Watkins (right) and Louise Corti (far right).
 Milo
Schield, Augsburg College, (shown with Louise Corti, IASSIST
Europe) argues that librarians interested in information literacy and data librarians interested in
data literacy should consider teaching statistical literacy since all
three involve critical thinking and since many social science arguments
involve statistics.
  At
At  "The
YES Competition offers college scholarship awards to high school juniors
and seniors who conduct outstanding research projects that apply
epidemiological methods of analysis to a health-related issue. David
Fraser (past President Swarthmore) views "
 Host
David Bressoud, Macalester College. In his keynote, "Core Concepts in QL", Milo Schield argued that QL must have core
concepts "that non-math faculty can understand easily, use regularly and
teach effectively."
  Danny
Kaplan, Macalester College, reviewed using everyday news stories in a
Quantitative Methods for Public Policy course . Policy
Topics: Response to Global Warming, Mad Cow Disease, Immigration and
Taxes. Quantitative topics that span policy topics: rates,
growth, trade-offs, detection and sampling. Average vs
Marginal Rates.
  Bernie
Madison, University of Arkansas, is teaching a unique QL course,
"News Math," based on articles in the everyday news. Topics:
 Bernie
Madison, noted that the
  Bernie Madison
(5 Jan): Talk at MAA. This combination of word and number is
deadly! Check your math majors at the ends of their careers, check your
graduate students, check your colleagues.... See "
 Carleton
Dean, Scott Bierman, hosted the two-day Associated Colleges of the
Midwest (ACM) workshop. He introduced speakers Joel Best (author
of Damned Lies and Statistics) and Bill Seagraves (Associate Dean
of Yale College). He reviewed data obtained in the use of
quantitative measures in
student portfolios.
 Milo
Schield, Augsburg College, analyzed some 500 words that involve quantity
without specifying a number. E.g., many, most, few and some.
Schield argued that students avoid using more precise measures (rates
and percentages) because they did not know how to describe or compare rates
and percentages. Includes Schield's 2004 list of the
top 25 books on Statistical Literacy.
  Chris
Wild (New Zealand) organized a panel on the topic of "Statistics for
Life: What statistical ideas or wkills matter most, and why?"
Speakers included Denise Lievesley (ISI President 2007-2009),
Stephen Stigler (ISI President 2003-2005) and Niels Keiding (ISI
President 2005 - 2007), Nick Fisher (ISI Vice President 2003-2005) and
Milo Schield. Speakers were asked to be provacative, over-the-top
in making predictions about the future of statistical education.
  Denise
Lievesley (UNESCO) noted that "No modern society can function
meaningfully as a democracy if the electorate remains statistically
illiterate." Essential skills: "Are useful in multiple life
contexts; Are associated with social, economic , educational and health
outcomes; Can be learned and taught; and Improve individual’s ability to
adapt to change and to shape their environment." "Numeracy is the
knowledge and skills required to effectively manage and respond to the
mathematical demands of diverse situations."
 Milo
predicted that 2005 would be the high point for the prevalence of
statisticians in MBA programs and for statistics in business programs.
 Nick
Fisher (ValueMetrics Australia) argued that managing uncertainty
involves: Understand basic statistical graphics and how they can be
misused. Appreciating that statistical numbers ... aren’t really
as precise as they appear. Being conscious of the possibilities of
biases … Realising that reliable data can be obtained by surveying
a relatively tiny fraction of population. Realising that apparent
differences between two averages may not be real.
  Enriqueta
D. Reston (Univ. of San Carlos,) investigated the statistical literacy
of 56 graduate students using a 15 item scale. Statistical
literacy was measured at two levels: (1) understanding basic statistical
concepts, and (2) ability to understand and follow claims and arguments
based on data and graphs presented in newspapers and research reports.
students performed relatively poorly in the 15- point scale (mean =6.93;
SD=2.39; range=12-2). For the students, their relatively poor
performance was an “ eye-opener“. Further, it has served as a motivation
for them to own the goal of developing statistical literacy.
 Fredrich
Ho presented
  The
IASE hosted a conference in Sydney April 2005 on "Statistical
Education and the Communication of Statistics. Kay Lipson
(center) and Brian Phillips (right) were co-chairs. Larry Weldon
(left) edited the
 Kay
Lipson (left) and Sue Kokonis (center) talked on "
 K.
Larry Weldon, Canada, proposed that those who design curricula
for early statistics courses should "provide a serious introduction to
graphical data analysis, at the expense of some traditional parametric
inference." In "
 Milo
Schield, Augsburg College US, presented a paper on "
 Cumming,
G. (left) , & Finch, S. (right). Inference by eye: Confidence intervals,
and how to read pictures of data.
American Psychologist, 60,
170-180. "For 95% confidence intervals and two independent means:
p £.05 when the bottom of one 95% confidence
interval overlaps the top of the other by about 50 percent."
  Jerry
Moreno's goal: "to produce liberal arts students who are
able ... to read a newspaper more intelligently." "We cannot afford to offer two intro courses." "Our
task is to define a few basic core statistics concepts ...and then build one course around those core concepts."
See also his article, "Statistics
as a Core Course in Liberal Arts" in
MAA's
 John McKenzie,
Babson College, reported on core concepts: Variability (96%), Association-causation (82%),
Randomness (77%), Significance: practical / statistical (77%), Data collection (75%),
Sampling
distributions (71%) and Hypothesis tests (64%). John classified
courses as "statistical
literacy-reasoning-thinking" (concepts), applied stats (applications,
service) & math. statistics (theory).
 The
8th annual session on Statistical Literacy was hosted by Milo Schield at
the ASA meeting in Minneapolis. Speakers included Lewis Cope
(left, Jane Miller (right), Marc Isaacson (below), Chris Olsen (lower
right), and Tom Burnham (below Isaacson). Some 90 people attended
the session. Lewis gave an animated presentation titled

 Marc
Isaacson, Augsburg College, reviewed the Statistical Literacy course
first offered by Capella University in April 2005 using Schield's Statistical Literacy
textbook. Students found this course "very demanding" but "very
satisfying." They ranked this course 2nd among their 15 Gen Ed
courses in challenging students to think
critically about the subject matter.
 Chris
Olson, Cedar Rapids Community Schools, presented a paper, "Epidemiology
as a Context for Teaching Confounding in Introductory Statistics." "surely the most needed
discussion about everyday inference is about what is probably the
greatest source of inferential error – the confusion of correlation with
causation, as well as a general ignorance of ... confounding."
 Tom
Burnham, Cognitive Consulting, presented a paper titled "An
Online Program for Decoding Ordinary English Descriptions and
Comparisons of Percentages and Rates." This
 Milo
Schield, Director of the W. M. Keck Statistical Literacy project at
Augsburg College, reviewed the prevalence
of chance-related terms on the web and used these prevalences to
identify those topics that should be part of a general statistical
literacy course. Includes unusual topics such as evolution, ESP and a
Bayesian approach to statistical significance.