“Conrad Carlberg is my favorite author on using Excel to analyze statistics.” Milo Schield, Director of the W. M. Keck Statistical Literacy Project.
Conrad Carlberg is a nationally recognized expert on quantitative analysis, and on data analysis and management applications such as Microsoft Excel, SAS and Oracle. He holds a Ph.D. in statistics from the University of Colorado and is a many-time recipient of Microsoft's Excel MVP designation.
Carlberg is a Southern California native. After college he moved to Colorado, where he worked for a succession of startups and attended graduate school. He spent two years in the Middle East, teaching computer science and dodging surly camels. After finishing graduate school, Carlberg worked at US West (a Baby Bell) in product management and at Motorola.
In 1995 he started a small consulting business which provides design and analysis services to companies that want to guide their business decisions by means of quantitative analysis - approaches that today we group under the term "analytics." He enjoys writing about those techniques and, in particular, how to carry them out using the world's most popular numeric analysis application, Microsoft Excel.
Carlberg and his wife live near San Diego with their two cats.
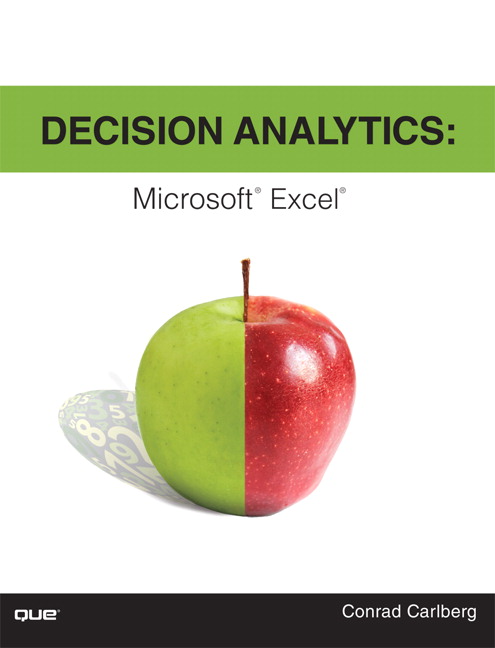
Decision Analytics: MS Excel by Conrad Carlberg (Que, 2013)
Crunch Big Data to optimize marketing and more!
Overwhelmed by all the Big Data now available to you? Not sure what questions to ask or how to ask them? Using Microsoft Excel and proven decision analytics techniques, you can distill all that data into manageable sets—and use them to optimize a wide variety of business and investment decisions. In Decision Analytics: Microsoft Excel, best selling statistics expert and consultant Conrad Carlberg will show you how—hands-on and step-by-step.
Carlberg guides you through using decision analytics to segment customers (or anything else) into sensible and actionable groups and clusters. Next, you’ll learn practical ways to optimize a wide spectrum of decisions in business and beyond—from pricing to cross-selling, hiring to investments—even facial recognition software uses the techniques discussed in this book!
Through realistic examples, Carlberg helps you understand the techniques and assumptions that underlie decision analytics and use simple Excel charts to intuitively grasp the results. With this foundation in place, you can perform your own analyses in Excel and work with results produced by advanced stats packages such as SAS and SPSS.
This book comes with an extensive collection of downloadable Excel workbooks you can easily adapt to your own unique requirements, plus VBA code to streamline several of its most complex techniques.
Classify data according to existing categories or naturally occurring clusters of predictor variables Cut massive numbers of variables and records down to size, so you can get the answers you really need Utilize cluster analysis to find patterns of similarity for market research and many other applications Learn how multiple discriminant analysis helps you classify cases Use MANOVA to decide whether groups differ on multivariate centroids Use principal components to explore data, find patterns, and identify latent factors
Register your book for access to all sample workbooks, updates, and corrections as they become available at quepublishing.com/title/9780789751683.
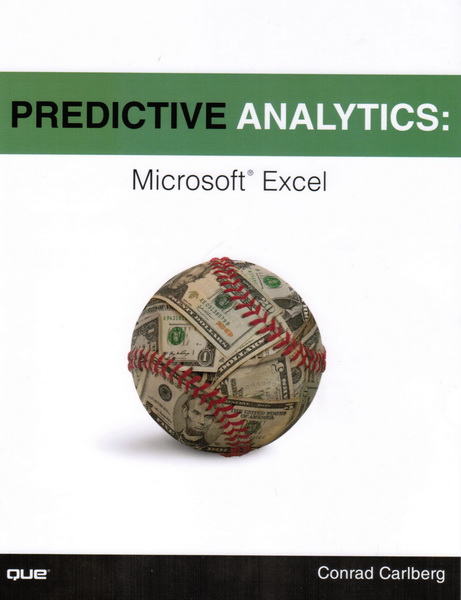
Predictive Analytics: MS Excel by Conrad Carlberg (Que, 2012)
Excel predictive analytics for serious data crunchers!
The movie Moneyball made predictive analytics famous: Now you can apply the same techniques to help your business win. You don’t need multimillion-dollar software: All the tools you need are available in Microsoft Excel, and all the knowledge and skills are right here, in this book!
Microsoft Excel MVP Conrad Carlberg shows you how to use Excel predictive analytics to solve real-world problems in areas ranging from sales and marketing to operations. Carlberg offers unprecedented insight into building powerful, credible, and reliable forecasts, showing how to gain deep insights from Excel that would be difficult to uncover with costly tools such as SAS or SPSS.
You’ll get an extensive collection of downloadable Excel workbooks you can easily adapt to your own unique requirements, plus VBA code—much of it open-source—to streamline several of this book’s most complex techniques.
Step by step, you’ll build on Excel skills you already have, learning advanced techniques that can help you increase revenue, reduce costs, and improve productivity. By mastering predictive analytics, you’ll gain a powerful competitive advantage for your company and yourself.
- Learn both the “how” and “why” of using data to make better tactical decisions
- Choose the right analytics technique for each problem
- Use Excel to capture live real-time data from diverse sources, including third-party websites
- Use logistic regression to predict behaviors such as “will buy” versus “won’t buy”
- Distinguish random data bounces from real, fundamental changes
- Forecast time series with smoothing and regression
- Construct more accurate predictions by using Solver to find maximum likelihood estimates
- Manage huge numbers of variables and enormous datasets with principal components analysis and Varimax factor rotation
- Apply ARIMA (Box-Jenkins) techniques to build better forecasts and understand their meaning
Statistical Analysis: MS Excel 2010 by Conrad Carlberg (Que, 2010)
Use Excel 2010’s statistical tools to transform your data into knowledge
Use Excel 2010’s powerful statistical tools to gain a deeper understanding of your data, make more accurate and reliable inferences, and solve problems in fields ranging from business to health sciences.
Top Excel guru Conrad Carlberg shows how to use Excel 2010 to perform the core statistical tasks every business professional, student, and researcher should master. Using real-world examples, Carlberg helps you choose the right technique for each problem and get the most out of Excel’s statistical features, including its new consistency functions. Along the way, you discover the most effective ways to use correlation and regression and analysis of variance and covariance. You see how to use Excel to test statistical hypotheses using the normal, binomial, t and F distributions.
Becoming an expert with Excel statistics has never been easier! You’ll find crystal-clear instructions, insider insights, and complete step-by-step projects—all complemented by an extensive set of web-based resources.
- Master Excel’s most useful descriptive and inferential statistical tools
- Tell the truth with statistics, and recognize when others don’t
- Accurately summarize sets of values
- View how values cluster and disperse
- Infer a population’s characteristics from a sample’s frequency distribution
- Explore correlation and regression to learn how variables move in tandem
- Understand Excel’s new consistency functions
- Test differences between two means using z tests, t tests, and Excel’s Data Analysis Add-in
- Use ANOVA and ANCOVA to test differences between more than two means
- Explore statistical power by manipulating mean differences, standard errors, directionality, and alpha
There is an Excel workbook for each chapter, and each worksheet is keyed to one of the book's figures. You'll also find additional material, such as a chart that demonstrates how statistical power shifts as you manipulate sample size, mean differences, alpha and directionality. To access these free files, please visit http://www.quepublishing.com/title/0789747200 and click the Downloads Tab.
Recommendations:
“Excel has become the standard platform for quantitative analysis. Carlberg has become a world-class guide for Excel users wanting to do quantitative analysis. The combination makes Statistical Analysis: Microsoft Excel 2010 a must-have addition to the library of those who want to get the job done and done right.” —Gene V Glass, Regents’ Professor Emeritus, Arizona State University
Business Analysis: MS Excel 2010 by Conrad Carlberg (Que 1995, 2007, 2010)
USE EXCEL 2010 TO GAIN DEEPER INSIGHTS, MAKE SMARTER DECISIONS, AND EARN MORE PROFITS
Using real-world examples, Carlberg helps you put Excel’s features and functions to work and get the power of quantitative analysis behind your management decisions.
Excel expert Conrad Carlberg shows how to use Excel 2010 to perform the core financial tasks every manager and entrepreneur must master: analyzing statements, planning and controlling company finances, making investment decisions, and managing sales and marketing. Using real-world examples, Carlberg helps you get the absolute most out of Excel 2010’s newest features and functions. Along the way, you’ll discover the fastest, best ways to handle essential tasks ranging from importing business data to analyzing profitability ratios.
Becoming an Excel expert has never been easier! You’ll find crystal-clear instructions, insider insights, complete step-by-step projects, and more. It’s all complemented by an extraordinary set of web-based resources, from sample journals and ledgers to business forecasting tools.
- Use Excel analysis tools to solve problems throughout the business
- Build and work with income statements and balance sheets
- Value inventories and current assets, and summarize transactions
- Calculate working capital and analyze cash flows
- Move from pro formas to operating budgets that help guide your management decisions
- Prepare business cases incorporating everything from discount rates to margin and contribution analysis
About MrExcel Library: Every book in the MrExcel Library pinpoints a specific set of crucial Excel skills, and presents focused tasks and examples for performing them rapidly and effectively. Selected by Bill Jelen, Microsoft Excel MVP and mastermind behind the leading Excel solutions website MrExcel.com, these books will:
- Dramatically increase your productivity–saving you 50 hours a year, or more
- Present proven, creative strategies for solving real-world problems
- Show you how to get great results, no matter how much data you have
- Help you avoid critical mistakes that even experienced users make
OTHER BOOKS:
- Business Analysis with QuickBooks by Carlberg (2011)
- Managing Data with Excel by Conrad Carlberg (2004)
- Excel 2002: The Complete Reference by Conrad Carlberg and Kathy Ivens (2001)
- Excel 2000: The Complete Reference by Kathy Ivens and Conrad Carlberg (1999)
- Business Analysis with Excel (Que Business Computer Library) by Conrad Carlberg (1995)
- The Excel 5 Professional Solutions Guide by Conrad Carlberg (1994)
- Microsoft Office Expert Solutions by Conrad Carlberg, Terry Allen, Susan Daffron and Shane Devenshire (1996)


