

Above: Dean Mark Peceny. His financial support made it possible for Statistical Literacy to be approved for General Education at UNM.

Erik Erhardt
Milo Schield

Fletcher Christensen
Dr. Erik Erhardt led the departmental effort to offer a consumer-based statistical literacy course along-side the traditional producer-based statistical inference course.
Dr. Milo Schield was hired as a consultant to inaugurate statistical literacy as a new course
in the General Education curriculum.
He was also hired as the course coordinator to
implement his course, to train the teachers and to teach a section of the course.
Dr. Fletcher Christiansen was a member of the statistical literacy committee and is the official 2022-23 UNM Statistical Literacy Coordinator.
2021: Letter to the Chronicle of Higher Education
Textbook: Statistical Literacy: Seeing the Story behind the Statistics. Table of contents, glossary and index (2021B).
2022 Fall:
- ISLP Newsletter Article (International Statistical Literacy Project)
- Proposed mathematics requirement for undergraduates in Communications and Journalism.
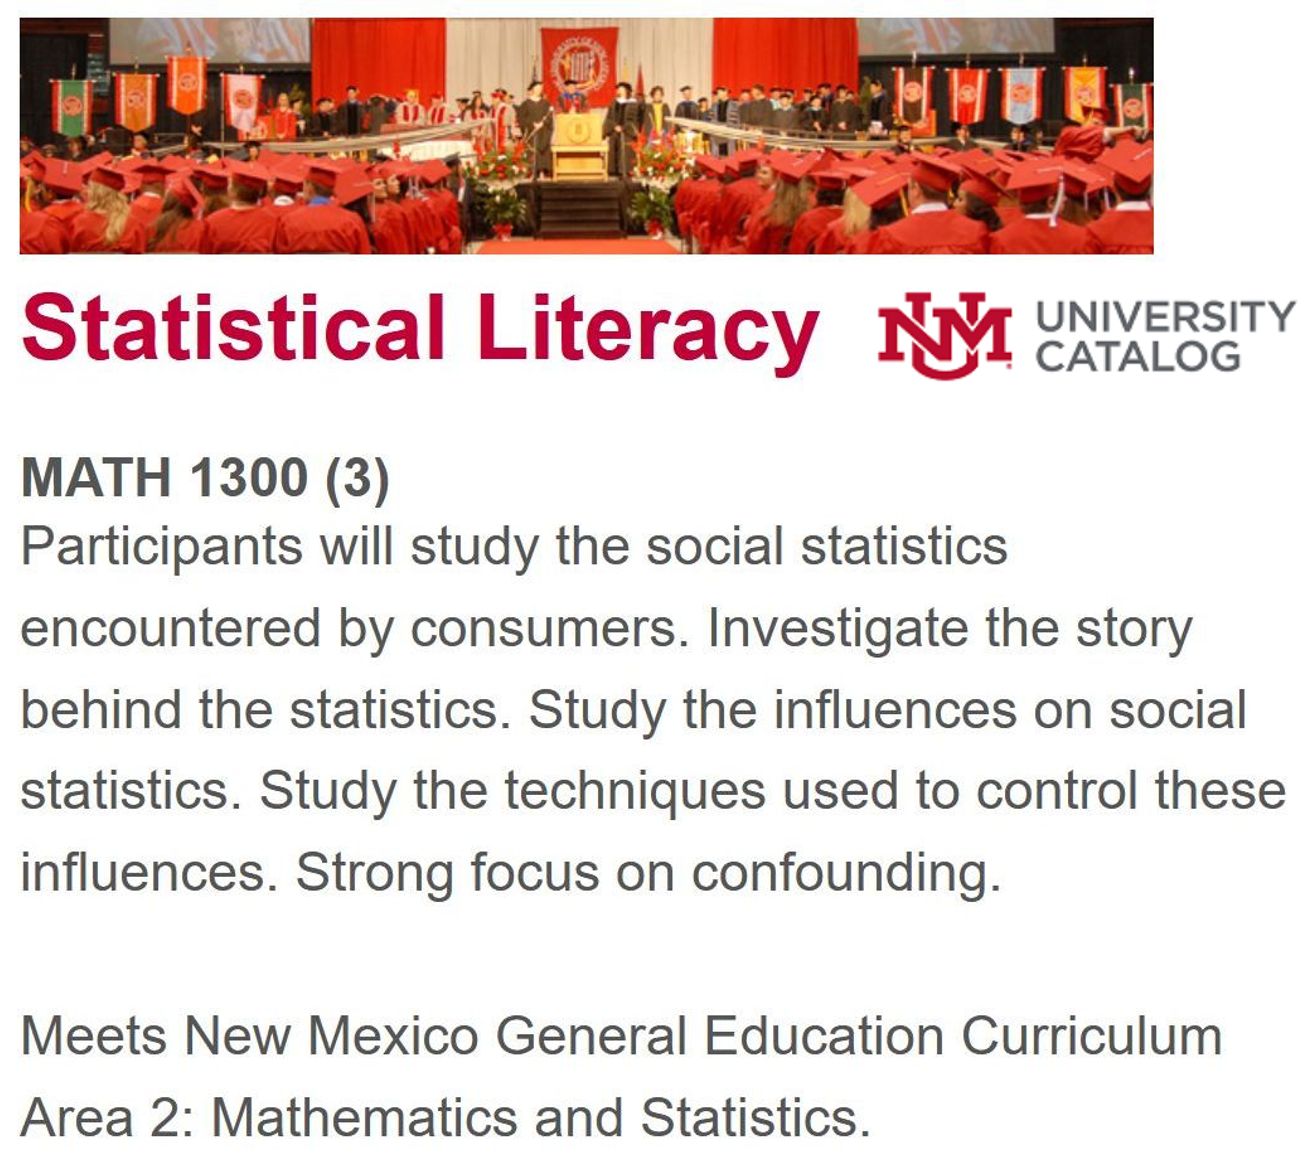
Math 1300 STATISTICAL LITERACY
2021-22 Spring: Syllabus: Online
2022 Fall: Syllabus: Online
2021 Fall:
- Advising: Fall 2021 Fall 2021 Spring 2020-21: Arts and Sciences) Business Administration
- Student Comments: 2022 Fall S1 S2: Describe Advise S2 S9: 2022 Spring S1 S2 S9
- Syllabus: Fall Syllabus F2F
2021/11/19: Teaching Statistical Literacy at a Community College
- Presentation at Central New Mexico Community College (CNMCC) Slides
2022: NNN Opening: Schield, Dean Peceny, Erhardt, Giebitz, DiDomenico, Kowalczyk and Christiansen
2022: Statistical Literacy UNM Math 1300: First Year Results Schield ASA JSM Slides
2021: Statistical Literacy Approved for General Education at UNM Schield ASA JSM
2017: Dr. Erhard's Statistical Literacy slides.
* Course number up for NMCAC approval 10/2-3 as Math 1300.
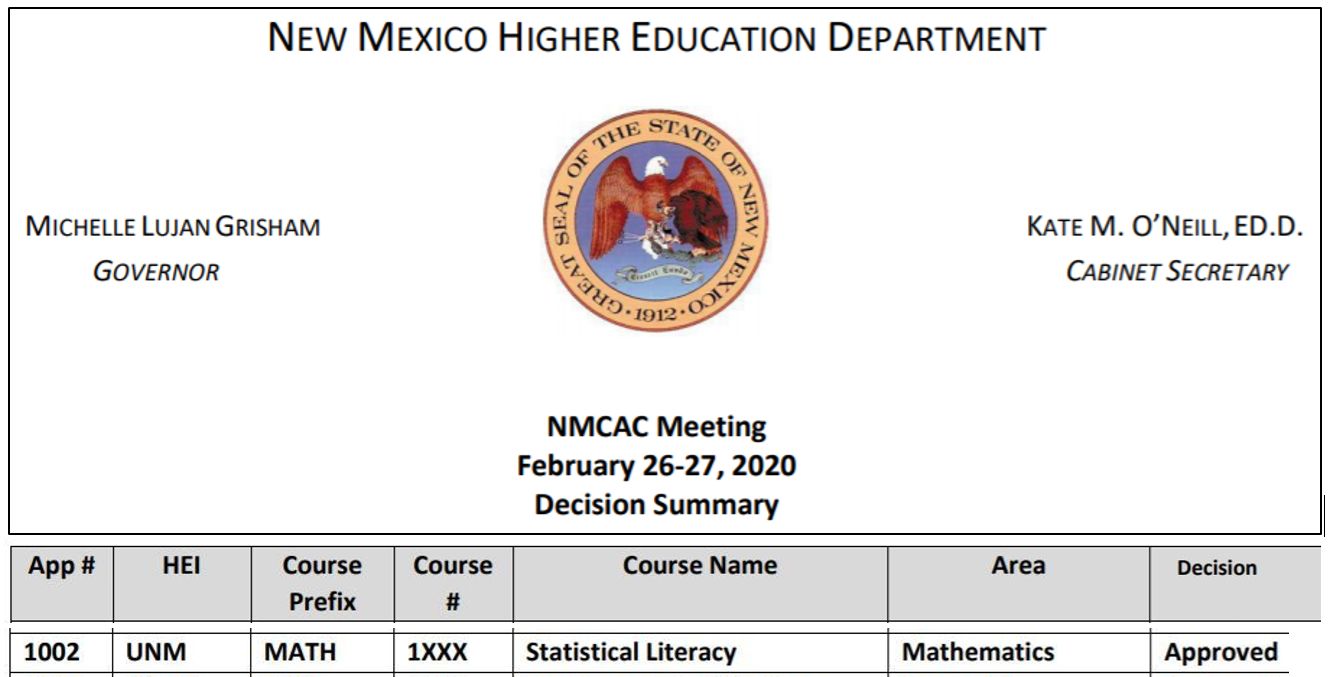
NMHED catalog approval: Dec 2, 2020. Vertical Horizontal

FORMS SUBMITTED
UNM Committee/Registrar Forms:
- 1a
- New Course Request (Form B)
- 1b
- Catalog Description
- 1c
- Syllabus
New Mexico Higher Education Department (NM HED)
- 2a
- Add Common Course Number
- 2b
- Student Learning Outcomes (SLOs)
New Mexico Higher Education: General Education
- 3a
- Gen Ed: Add a Course
- 3b
- Assessing Student Learning Outcomes (SLO)
- 3c
- Goals and Student Learning Outcomes (SLO)
- 3d
- Sample Assessment
UNM
- 4a
- New Course Signoff (Form C)
- 4b
- Budgetary Load Implications
TECHNICAL INSTRUCTIONS
UNM: Number Enrolled (slides) Accessing class lists (slides)
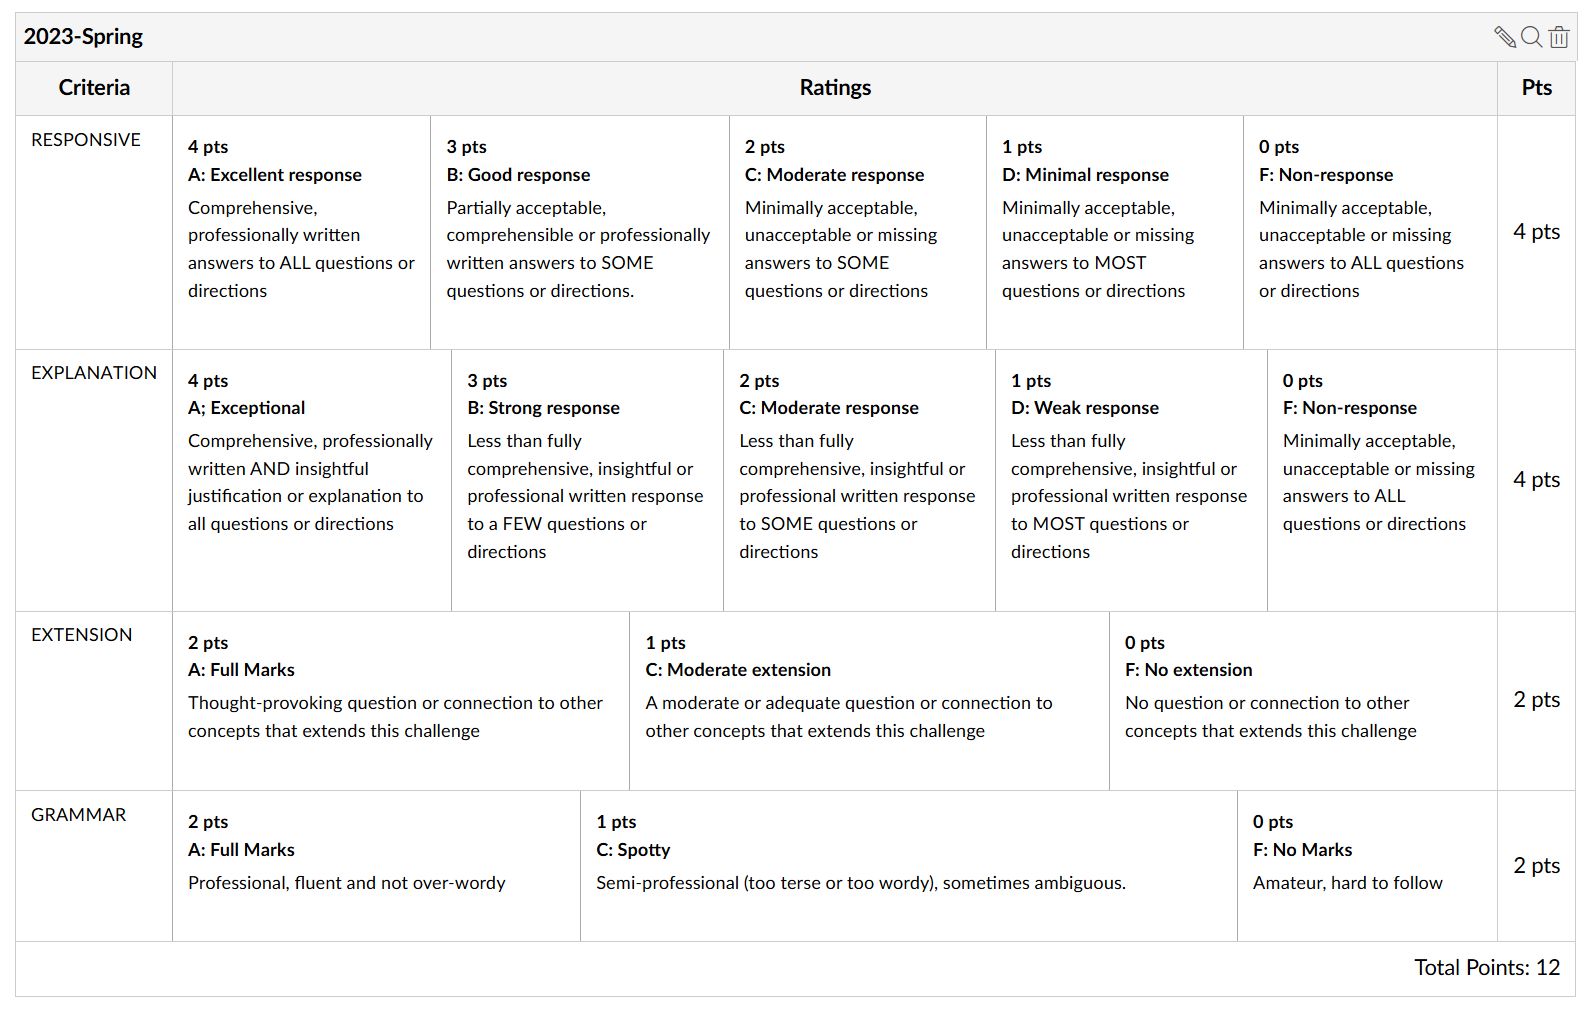
Canvas: Creating Writing Challenges. (slides) Writing Forum Rubric V1
Canvas: Writing Student Response. (slides)
Canvas: Create Survey. (slides)
Canvas: Embedding videos using Kaltura. (slides)
Canvas: Importing Videos into Canvas. (slides)
Canvas: Writing Peer Reviews. (slides)
Canvas: Grading 1-Line Writing. (slides)
Canvas: Grading Peer Reviews. (slides)
Canvas: Create Quiz from Quiz Bank. (slides)
Canvas: Download Survey Data. (slides)
Canvas: Copy between Courses. (slides)
Canvas: Grades: Late Zeroes. (slides)
Canvas: Import External Course. (slides)
Canvas: Surveys: Copy to Excel. (slides)
Canvas: Importing Grades from Odyssey. (slides).
STATISTICAL LITERACY TEXTBOOK:
Schield's Statistical Literacy textbook is being used as the textbook for Math1300 at the University of New Mexico. This text was developed as a key part of the W. M. Keck Statistical Literacy Project.
In 2005, Capella University began offering Statistical Literacy on-line using this textbook. Dr. Valerie Perkins, Dean of Capella's School of Under-graduate Studies, notes, “Schield's approach to statistical literacy helps Capella students think critically while satisfying Capella's general education requirement in mathematical and logical reasoning.”
Peter Holmes, Royal Statistical Society Centre for Statistical Education, said, “I am convinced that the standard first course in statistics, which focuses on getting to significance testing and confidence intervals, isn't an appropriate aim for a lot of students. I think Milo's approach to statistical literacy is much closer to what is needed by journalists, by policymakers, by those in business commerce or management and by most people in everyday life.”
Statistical Literacy is closely related to numeracy, quantitative reasoning, quantitative literacy and statistical thinking/reasoning. They all focus on concepts or techniques involving numbers in context — typically numbers presented in the daily news.
But there are differences.
- Quantitative reasoning typically focuses on math topics such as rates and rates of change, percent of, graphs of change (first and second derivatives), linear and exponential rates of growth, accumulation (integral), installment loans, savings and weighted averages, indexes and condensed measures, estimation, plane geometry, graphical production and representation and probability (single and conditional).
- Quantitative literacy focuses much more on consumer-related topics such as reading and interpreting ratios, rates and percentages as encountered in statements, tables and graphs.
- Statistical thinking/reasoning (producer statistical literacy) typically focuses on statistics involving distributions and variation — specifically random variation such as that encountered in random selection or random assignment.
All three are typically quiet on causation, confounding and study design.
Statistical Literacy (consumer-based) is quite different. Statistical Literacy studies statistics used as evidence in everyday arguments. As such this text may be closer to critical thinking or rhetoric than to mathematics or statistics. This text uses the admonition, “Take CARE!” as a reminder that statistics are human constructs. Statistical literacy studies those factors that influence the size and direction of a statistic. Each of the four letters in CARE stand for a kind of influence on the size of a statistic: Context (comparisons, ratios, study design and confounding), Assembly (how statistics are defined and presented), Randomness (chance, margin of error and statistical significance) and Error or bias. The bulk of the book is spent on the first two types of influence.
The goal of the text is to help readers evaluate the strengths and weaknesses in statistics that are used as evidence in everyday arguments. These statistics include government-generated statistics: country-wide statistics (c.f., US Statistical Abstract), education statistics (c.f., National Assessment of Educational Progress) and health statistics (c.f., Center for Disease Control).
This text is quite different. Instead of algebra, it uses ordinary English to describe and compare counts, measures and conditional probabilities. It focuses on reading and interpreting statistics presented in tables and graphs. It presents a simple technique to show how a factor is “taken in account” or “controlled for.” It requires “hypothetical thinking” for students to imagine how things might have been defined, measured, compared or presented differently. It requires hypothetical thinking for students to imagine plausible confounders for observed associations.
2016: Augsburg Student Evaluations of STAT 102 by Schield ASA/JSM. Course Comparison: STAT102 vs STAT 101
Schield's “Statistical Literacy 202”
0-2021 (very different from prior editions)
- Fifth edition is almost the same as fourth edition with error corrections and better handling of longitudinal studies.
- Outcomes using Take CARE methodology (34 KB)
- Detailed Tables of Contents for all Chapters: (120 KB)
CONTENTS For chapter overview, download both audio and 6up overview. Play audio while watching the overview.
- Story behind the Statistics Ch1-Overview6up Ch1Audio Ch1-Handout-1up
- Take CARE Ch2-Overview6up Ch2Audio Ch2-Handout-1up
- Understanding Measurements Ch3-Overview6up Ch3Audio Ch3-Handout-1up
- Describing Ratios using Percent & Percentage grammar Ch4-Overview6up Ch4Audio Ch4-Handout-1up
- Describing Ratios using Rate & Chance grammar
- Comparing Ratios Ch6-Overview6up Ch6Audio Ch6-Overview1up
- Understanding Ratios Ch7-Overview6up Ch7Audio Ch7-Overview1up Medical Tests
- Understanding Statistical Significance Ch8-Overview6up Ch8Audio-18min-2.3MB Review-Worksheet
- Tables of Figures, Tables, Stories and Equations
Introduction (250 KB) Ch0-Overview6up
Glossary and Index (227 KB) Glossary Ch 1 and 2. Ratio Describe and Compare Sheet. Glossary All. Ch 1.
Contents: 321 pages, 5,620 paragraphs, 99,412 words. 510,254 characters.
16 equations, 26 stories, 103 tables, 163 figures. Glossary 161 terms.
BOOK BACKGROUND:
This book was based on research findings of the W. M. Keck Statistical Literacy Project.
For an overview, see Isaacson's “Statistical Literacy — Online at Capella University.”
For an overview of the conceptual design, see Schield's “Statistical Literacy and Liberal Education at Augsburg College.”
For a briefing on the “Take CARE” methodology, see “Take CARE”
For a review of the technical aspects, see Schield's Statistical Literacy Curriculum Design.
For a review of difficulties in reading tables and graphs, see Schield's “Statistical Literacy Survey: Reading Tables and Graphs.” For papers on teaching confounding using the new graphical technique, see:
- Presenting Confounding Graphically Using Standardization, 2006 Stats magazine
- Confound Those Speculative Statistics 2009 ASA
For papers on teaching the social construction of statistics, see:
- Teaching the Social Construction of Statistics 2007 Midwest Sociological Society
- The Social Construction of Rankings 2010 ASA
Order Status:
The 2022B edition is being distributed by the bookstore at the Univ. of New Mexico (Albuquerque). This edition goes with the more than 1,000 Moodle exercises that are available to teachers that use this book.
Statistical Literacy at Augsburg College: GST 200
- Ad: Statistical Literacy Course Online at AugsburgCollege. Milo Schield, Instructor Syllabus: 2010, 2015, 2016
- GST 200 is approved by Augsburg College: both a little Q (QL foundations) AND a big-Q (QL applications) course (6/2008)
- 2008StatLit2A Brochure: Course Overview. 2008
- Brochure that highlights the critical thinking aspects of the course including the focus on hypothetical thinking. 2007
- Application for a “Big Q” qualification at Augsburg College. 2007
- Statistical Literacy: Purpose and Definition. Tom Burnham May 2003.
Over a Hundred Topics (Over a Thousand Problems):
As Lynn Steen noted, “concept” QL courses tend to be light on exercises. Over 130 homework topics involving right-wrong exercises have been identified for this book. More than a hundred of these topics have been implemented in Moodle as multiple choice quizzes with over a thousand problems. Having right-wrong exercises online gives students immediate feedback, eliminates the need for instructor grading, minimizes the class time needed to review these topics, and allows the instructor to see which kinds of exercises are giving the students the most difficulty. Here is a current list of the class-room tested, Moodle-based, right-wrong exercises.
Web-based Part-Whole Drill Programs:
Videos describing:
The part-whole reading drill program has 186 problems. 131 descriptions, 43 common-part comparisons and 12 distinct part comparisons.
The writing drill program currently has 301 problems: 6 chance-related, 266 tables, 14 bar graphs and 15 pie charts.
The most recent upgrade was to add chance/probability grammar to both programs.
Odysseys2Sense: a game of lively discourse
Odysseys (a unique web forum) is used to facilitate critical thinking. See this under Statistical Literacy tools. Fall 2012 Challenges
Student survey: Spring 2013 Fall 2013. Advice to reviewers: References Huemer