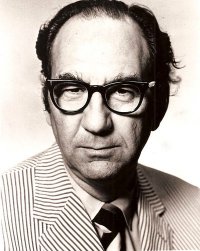
This page is dedicated to Victor Cohn (above, 1919-2000), who authored the classic News and Numbers. See Highlights, Schield-Cohn-Retrospective-6up. The Victor Cohn prize for excellence in medical science reporting.
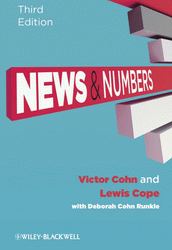
- 1989: First Edition: Introduction and Table of Contents.
- 2001: Second Edition coauthored with Lewis Cope.
- 2011: Third Edition coauthored with Lewis Cope and Deborah Cohn Runkle.
Numbers Please: We're Journalists by Nicole Bailey
News with Numbers NewsLab blog by Deborah Potter. 12/29/2009
Why Journalists Can't Add by Dan Seligman. Jan 21, 2002 Forbes.
“There are a lot of people in the public who are intimidated by numbers and I think a lot of them become reporters and editors.” — Tom Barrett, political reporter, The Vancouver Sun
“Simply reporting what someone said or did is no longer enough to ensure an information professional’s career,” says Robert Niles, editor of the Online Journalism Review and author of an online statistical primer. “Information professionals who wish to survive the Internet age must be able to synthesize and analyze words, deeds, and data so that they can report to their readers and clients the reality of what is happening in their world today.” — Why Math Matters by Chip Scanlon.
WHAT-TO BOOKS ON NUMERACY FOR JOURNALISTS:
- News and Numbers: A Guide to Reporting Statistical Claims and Controversies in Health and Other Fields by Victor Cohn and Lewis Cope w. Deborah Cohn Runkle, 3rd ed. 2011. (1st ed. by Victor Cohn 1989; 2nd ed. co-authored with. Lewis Cope 2001)
- Know Your Chances: Understanding Health Statistics by Steven Woloshin, Lisa M. Schwartz, H. Gilbert Welch, Univ. of California Press, 2008.
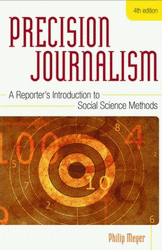
- Precision Journalism by Phillip Myer 4th ed. 2002 (1st ed. 1970; 2nd ed. 1978; 3rd ed. 1991)
- The Newsroom Guide to Polls & Surveys by Wilhoit & Weaver (1990)
HOW-TO SOURCES ON NUMERACY FOR JOURNALISTS:
- Numbers in the Newsroom: Using Math and Statistics in News by Sarah Cohen for Investigative Reporters and Editors, Inc., 2001. Contents Danger! Numbers in the Newsroom Tip Sheets: “Here are three ways to compare 400 arrests for drunken driving this year compared with 100 last year: ‘Four times more’ is not only confusing but wrong; [right] ‘Three times more’ or ‘four times as many.’”
- The Data Journalism Handbook The Data Journalism Handbook How Journalists Can Use Data to Improve the News by Jonathan Gray, Lucy Chambers, and Liliana Bounegru. Publisher: O'Reilly Media Released: July 2012 Pages: 242. Free pdf
- Math Tools for Journalists by Kathleen Woodruff Wickham, 2nd ed. 2003. Table of Contents
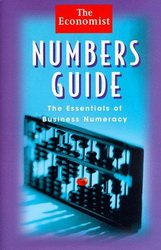
- The Economist Numbers Guide: The Essentials of Business Numeracy. by Richard Stutely. 4th ed. 2001
- Understanding Education Statistics: It's Easier (And More Important) Than You Think — Educational Research Service. This 42-page booklet presents educational statistics in a readable, easy to understand way relevant to practitioners. [Out of Print]
WEB SITES ON NUMERACY FOR JOURNALISTS:
- Statistics Every Writer Should Know by Robert Niles (Online). Topics: Mean, median and percent; Per capita and rates; Standard deviation and normal distribution, Margin of error and confidence interval; Data analysis (Where did the data come from? Have the data been peer-reviewed? How were the data collected? Be skeptical when dealing with comparisons. Be aware of numbers taken out of context). Sample sizes; Finding data on the internet; and statistical tests.
- Website Journal of the National Cancer Institute: Reporting on Cancer Research. Tip-sheets: Number glossary (absolute risk, relative risk); Statistics glossary (p values, confidence intervals, survival); Questions to guide reporting (e.g., how important are the outcomes?); and How to highlight study cautions (useful phrases).
- More Numerate: Numbers and Evidence for News Writers “What is the Numbers, News, & Evidence Project? Quantitative data are central to the presentation of high-quality information, yet making sense of numbers has not been considered the greatest strength of journalists and many other professionals. Knowledge of numbers affects reporters writing about topics as diverse as the local school district budget to the latest scientific reports on global warming. Supplying meaningful information to the populace can be seen as a key journalistic pursuit. To date, there have been few systematic instructional approaches used in journalism schools to help reporters improve their understandings of numbers. To address this problem, we have developed a two-week post-secondary module to improve quantitative awareness, critical analysis, and evidence-based perspectives among journalism students and journalism instructors.”
- Statistical Literacy blog by Armin Grossenbacher.
- Stats and Stories: Radio show/podcast involving news and numbers by John Bailar and Richard Campbell (director of the journalism program at Miami University in SW Ohio). “Our first program on ‘Baseball and statistics’ ... includes an interview with Jim Albert (the editor of the Journal of Quantitative Analysis and Sports) and a package and person-on-the-street interviews produced and conducted by student reporters (see the ‘About’ page on this website for a listing of all participants).” “Suggestions for future topics (and guests) are welcome. Topics should be wide ranging covering serious and lighter topics... .”
- IASSIST: International Association of Social Science Information Services and Technology
- Databrariarns: Wide-ranging blog. See Moving students from reference to critical data literacy.
ARTICLES ON NUMERACY FOR JOURNALISTS:
- Thinking with Data: A Cross-Disciplinary Approach to Teaching Data Literacy and Proportionality. Presented at the Annual Conference of the American Educational Research Association, May 2010, Denver, CO. “The TWD project has designed and evaluated a set of four 2-week, integrated modules for cross-disciplinary implementation in 7th grade social studies, mathematics, science, and English language arts. We have found that standards in all four subject areas address three broad categories of data literacy: formulating and answering data-based questions; using appropriate data, tools, and representations; and developing and evaluating data-based inferences & explanations.”
- Designing and assessing numeracy training for journalists: Toward improving quantitative reasoning among media consumers by Ranney, M. A., Rinne, L. F., Yarnall, L., Munnich, E., Miratirx, L., & Schank, P. (2008). In P. A. Kirschner, F. Prins, V. Jonker, & G. Kanselaar (Eds.), International Perspectives in the Learning Sciences: Proceedings of the Eighth International Conference for the Learning Sciences, Volume 2 (pp. 2-246 to 2-253). International Society of the Learning Sciences, Inc.
- Help Yourselves (and the Public) Know the Truth by Victor Cohn in Significance 1999.
-
How to Help Reporters Tells the Truth
by Victor Cohn (Author of News and Numbers), ASA 1999
“I believe that six principles pretty much sum up what the media and the public need to know about statistical thinking: (1) the certainty of uncertainty, (2) the use of probability, (3) the power of large numbers, (4) the danger of bias, (5) the ubiquity of variation, and (6) the hierarchy of studies. I believe that by your imparting these principles, we — the media and the public — can go a long way toward judging the claims and statistics that are thrown at us.” - Toys, Tales, and a Journalist’s View of Statistics by Lewis Cope ASA 2005. Excerpt — Four Key Tests: 1. Bigger numbers are better; 2. All studies aren’t equal. (Did the study last long enough? Does the difference make a difference? Should the findings be applied broadly or narrowly?); 3. Is there another explanation?; 4. Peer review and journalistic review. (Is there possible bias? Is there a scientific fit? Is it useful and practical? What now?)
- Statistics for Innumerate Journalists by Stephen Doig (Arizona State Univ.) 2007 ASA 4up slides
SEMINARS AND WORKSHOPS ON NUMERACY FOR JOURNALISTS:
- Basic Numeracy for Journalists — two-day workshop by Derek Luyt at the Institute for the Advancement of Journalism (Union of South Africa). Outcomes: (1) An understanding of the importance of numbers and statistics for journalists across a wide range of stories; (2) A clear grasp of the basic numeracy skills which all journalists need in order to improve their reporting; (3) A basic understanding of the questions which journalists need to ask (and answer) in considering the validity and usefulness of the numbers and statistics they come across in the course of their investigations; (4) A range of sources and contacts useful for investigating and (5) Reporting on numerical and statistical related stories; (6) An appreciation of how the appropriate use of numbers can bring, and (7) Greater significance, and interesting angles, to your stories.
- Thinking With Data — The Thinking With Data (TWD) initiative addresses the development and use of technology to increase the data literacy of teachers and students. TWD promotes engagement with statistics, probability and scientific inquiry across the curriculum, preparing students to use the increasing amount of societal and scientific data available on the Internet.
- 2011: Medicine in the Media July 13–16, 2011 Dartmouth College Agenda
-
2010: RSS Workshop for Journalists on Health Stats.
“This workshop will help journalists see through the numbers behind big
stories in health and medicine. Focusing on real stories from recent
news, topics will include:
- Swine flu and other epidemics
- Medical trials — how to assess the evidence
- What is a ‘quality adjusted life year’ and how do we measure it?
- The ‘Spirit Level’ — is a more equal society really better for everyone?
- Reporting risk responsibly
- Making fair comparisons between the performance of hospitals and surgeons
- Common pitfalls in reporting statistics.”
ARTICLES ON DATA LITERACY:
- Thinking with Data: A Cross-Disciplinary Approach to Teaching Data Literacy and Proportionality. Presented at the Annual Conference of the American Educational Research Association, May 2010, Denver, CO. “The TWD project has designed and evaluated a set of four 2-week, integrated modules for cross-disciplinary implementation in 7th grade social studies, mathematics, science, and English language arts. We have found that standards in all four subject areas address three broad categories of data literacy: formulating and answering data-based questions; using appropriate data, tools, and representations; and developing and evaluating data-based inferences & explanations.”
- The Data Journalism Handbook.
- Making Data Meaningful by UN Economic Commission Europe. The Making Data Meaningful guides are intended as a practical tool to help managers, statisticians and media relations officers in statistical organizations use text, tables, charts, maps and other devices to bring statistics to life for non-statisticians. Part 1: A guide to writing stories about numbers: The first guide provides guidelines and examples on the use of effective writing techniques to make data meaningful. Part 2: A guide to presenting statistics: The second guide provides guidelines and examples on preparing effective tables, charts and maps, and using other forms of visualizations to make data meaningful. It also offers advice on how to avoid bad or misleading visual presentations. Part 3: A guide to communicating with the media: The third guide aims to help producers of statistics find the best way to get their message across and to communicate effectively with the media. It contains suggestions, guidelines and examples.
- Mathematizing middle school: Results from a cross-disciplinary study of data literacy by Vahey, P., Yarnall, L., Patton, C., Zalles, D., & Swan, K. (2006, April). Presented at the Annual Conference of the American Educational Research Association, April 2009, San Diego, CA
- Designs for assessing foundational data literacy by Zalles, D. (2005). SERC site.
- Information Literacy, Statistical Literacy and Data Literacy by Milo Schield IASSIST Quarterly 2004 “The evaluation of information is a key element in information literacy, statistical literacy and data literacy. As such, all three literacies are inter-related. It is difficult to promote information literacy or data literacy without promoting statistical literacy. While their relative importance varies with one’s perspective, these three literacies are united in dealing with similar problems ... .”
- GLOBE Year 6 evaluation: Explaining variation in implementation. by Means, B., Penuel, W. R., Crawford, V. M., Korbak, C., Lewis, A., Murphy, R. F., Shear, L., Villavicencio, C., Vinson, E. Y., & Yarnall, L. (2001). Menlo Park, CA: SRI International. [Global Learning and Observations to Benefit the Environment (GLOBE)]
JOURNALISM REPORTS AND FINDINGS:
-
1995: Tomorrow’s Broadcast Journalists — A Report and Recommendations
— From the Jane Pauley Task Force on Mass Communication Education,
published in 1996 by the Society of Professional Journalists.
Part 1: Broadcast Journalism Education Trends and Comparisons
Part 2: Survey of TV News Directors and Broadcast Journalism Educators “a whopping 57.9% of the news directors said none of the applicants they were seeing was adequately prepared in terms of ability to understand statistical materials, such as a budget.” “In general, educators are most critical of their students for not understanding statistical material, for not understanding international affairs, for lacking knowledge of basic economics, for not having a second language, for their inability to do math, and for their lack of an understanding of how to use public documents (Charts 7a, b, c & d).”
NUMERACY BLOGS FOR (OR ABOUT) JOURNALISTS OR VISUALIZING DATA:
- Why Math Matters by Chris Scanlon. “Competency with numbers requires: (1) Basic working knowledge of arithmetic; (2) Familiarity with statistics; (3) Ability to calculate percentages, ratios, rates of change, and other relationships between numbers; (4) Ability to translate numbers into terms that readers and viewers can understand; (5) Knowing the difference between median and mean averages; (6) Understanding of margin of error in polling; (7) Basic understanding of probability theory; and (8) Understanding of graphs and other pictorial representations of numbers.”
- Numeracy — a minuscule problem (2011) — by Doug Fisher. “It's what happens when a reporter tries to change the factor to a percent or vice versa and forgets to move the decimal.”
- Cool Statistics: Stats worth looking at — by Alexander
JOURNALISM INSTITUTES:
- Poynter Institute
-
Investigative Reporters and Editors
IRE Resource Center
(member price / non-member price)
Investigative Reporter’s Handbook, 5th Edition by Brant Houston, Len Bruzzese & Steve Weinberg $48 for members $58 for nonmembers
Numbers in the Newsroom: Using Math and Statistics in News by Sarah Cohen $15/$25
Computer-Assisted Research: Information Strategies and Tools for Journalists by Nora Paul & Kathleen A. Hansen $18/$28
Computer-Assisted Reporting: A Practical Guide, 3rd Edition (ebook only) by Brant Houston $15
Understanding Crime Statistics: A Reporter’s Guide, 2nd Edition by Kurt Silver & Ted Gest $15/$25
JOURNALISM NUMERACY PROJECTS AND PROGRAMS:
- Number literacy: The Hewlett Journalism Numeracy project was based on a grant from the William and Flora Hewlett Foundation. The project was led by the University of California, Berkeley, and SRI International provided support and consulting. We co-developed a supplemental curriculum to infuse reasoning around numbers into a basic journalism graduate education program. A set of measurement instruments was developed to examine the effectiveness of the curriculum.
-
Data and science literacy:
GLOBE Program.
“As a curriculum resource for teachers, GLOBE
offers a set of hands-on, inquiry-based activities for students. The
emphasis in participation is on accurately collecting data, within a
framework of increasing science content and conceptual knowledge, and
reporting data to the GLOBE Web site. The goals of the Program are to:
(1) help K–12 students improve their achievement in science and
mathematics and their skills in the use of computer and network
technology while helping students and teachers meet local education
standards; (2) help expand the pipeline of potential future scientists
and researchers for industry, academia, and in support of Government
programs, including those of NOAA, NASA, and NSF; (3) increase awareness
of the environment from a scientific viewpoint, without advocacy
relative to issues; and (4) improve student understanding of science
through involvement in performing real science.
At the GLOBE Annual Conference in July 2001, staff reported that more than 17,000 teachers had completed GLOBE training, and that there were more than 10,000 GLOBE schools in 97 countries. This reach across so many nations means that nearly every biome on Earth is represented in GLOBE.
GLOBE provides schools with a scientific framework and educational resources, but it is not a curriculum. Schools and teachers are able to choose which grade levels and classes will participate and the way in which the Program will be integrated into the local curriculum.”
JOURNALISM STATISTICS COURSES:
- Indiana University: Statistics and Mathematics for Journalism. Course Description Writing with Numbers: Generally accepted conventions for presenting mathematical content in writing. Basic Mathematics: Essential mathematical topics for the working journalist, including percentages, inflation, and rates of change. Descriptive Statistics: The written and graphical presentation of statistical information. Inferential Statistics: Drawing conclusions based on data. Spreadsheets: The use of spreadsheets to analyze and to present data. Finding Data: A special focus in placed on the use of the internet in find data.
RSS GETSTATS CAMPAIGN:
- GetStats is the Royal Statistical Society’s 10-year statistical literacy campaign. 2011 presentation at Stats Canada. “Aims to help build a society in which lives and choices are enriched by an understanding of statistics.”
- Statistical Awareness for citizenship: RSSCSE 20 Jan 2009. “What a student should be able to identify and critically evaluate This includes: newspaper and popular magazine accounts of an issue in which statistics was used; the use of statistics in other subjects; officially produced tables of data; graphs of data.”
MAKING SENSE OF STATISTICS:
- Straight Statistics: “a campaign established by journalists and statisticians to improve the understanding and use of statistics by government, politicians, companies, advertisers and the mass media. By exposing bad practice and rewarding good, we aim to restore public confidence in statistics.” Byline: “Numbers shape the world. Twisting them for political, business or personal advantage is widespread — and often undetected.” David Lipsey is Chairman of Straight Statistics, a member of the House of Lords, a political journalist and former Deputy Editor of The Times. Nigel Hawkes is the Director of Straight Statistics. As a journalist, he worked for The Observer as Science Correspondent and for The Times as Science Editor, then Health Editor. Straight Statistics collaborated with Sense about Science to produce a simple guide to numerical and statistical traps, Making Sense of Statistics.

