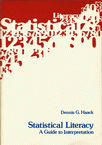
Dennis Haack (1944-2021). (Obituary)
In 1979, Dennis had the clearest vision of what statistical literacy should be: to teach students how to interpret the media statistics they come in contact with every day. In a conversation, Dennis said that he never used the phrase “statistical literacy” and that it doesn't appear anywhere in his book. He recalled that Statistical Literacy was suggested by the publisher as the title. [Milo Schield]
Statistical Literacy (1979) by Dennis G. Haack
 Preface:
Extract:
All teachers of statistics courses are doubtless aware of the
negative attitude students often have toward learning about statistics.
Further, most of us have wondered where this problem of attitude arises —
with the teacher, the learner, or the course itself. Many teachers feel that
students don’t know what’s best. Statistics is a bitter pill that must be
taken for the student’s own well-being. The same teachers often feel that
the students will later look back on their elementary statistics course and
realize that it was indeed valuable.
But does the problem really lie with the teacher or with the type of initial statistics course we give students? Few who teach statistics courses are data analysts; yet this is the course we try to teach. Using Greek and other mathematical symbols that few students understand we try to teach students data manipulation. In addition, we try to teach students when and how to use techniques such as a t-test; yet it is doubtful that any of them will ever have a need to analyze data using -such a test, and it is just as doubtful that those who will have to run a t-test will do so properly. Is it necessary for a first course in statistics to teach data manipulation, or would we do better to emphasize the interpretation of statistics?
In order to answer this question, let us first decide how students are likely to come in contact with statistics. Rather than designing an experiment and collecting and analyzing the data, students are more likely to read the results of an experiment and need to interpret those results. Some students may never read research reports, but all will be exposed to newspapers, magazines, radio, and television. Through the media everyone comes in contact with statistics each day.
Statistics is more a language in this regard than a research tool. This language is often misused, giving our profession a bad name. 1 Misuse of the language of statistics is statistical doublespeak. Why don’t we teach students how to understand statistics as a language so they can detect the statistical doublespeak they encounter in the media as well as in their fields of study? This book and the course for which it is designed have this very objective: to teach students how to interpret statistics so they can detect statistical doublespeak in the media and in their fields of study.
If we decide that a first course in statistics should emphasize the interpretation of statistics, what adjustments can be made in the usual course? First, symbolic formulas are not as necessary. Students are to be concerned with what a statistic means, not how to calculate the statistic. Many statisticians agree that the amount of formulation in elementary statistics courses need to be reduced. It is revolutionary, however, to eliminate all formulas. Many feel that this is a drastic step – and it is! But I have found that students accept it enthusiastically.
[Click on Preface link above for the remainder]
Table of Contents
- The Language of Statistics: Statistical Doublespeak, Types of Statistics, A History of Statistics.
- Background Influences on Statistics: The Source, Types of Data, Definition and Measurement, Considerations, The Sample Survey.
- Natural and Descriptive Statistics: Natural Statistics: The Census, Graphic Displays of Data, Misuse of Graphs, Indexes of Central Tendency, Indexes of Dispersion, Describing a Data Set, Descriptive Statistics: The Mechanics (Optional).
- Probability in Inferential Statistics: Statistical Inference: Why We Need Probability, Probability: History and Theory, The Gambler's Fallacy, The Normal Distribution and the Empirical Rule, Two Distinct Groups: The Dichotomous Population, The Chi-Square Distribution, Decision Making, Decision Theory: An Example (Optional).
- The Sample Survey: Scientific Polling, Faulty Preelection Polls, Simple Random Sampling, Other Sampling Procedures, Distribution of the Sample Proportion, Sampling Distribution of the Mean.
- Statistical Inference: Estimating a Population Proportion, Testing a Statistical Hypothesis Concerning the Population Proportion, Estimating a Population Mean, Tests of Hypotheses Concerning the Population Mean, Nonparametric Statistics, The Role of Descriptive Statistics in an Inferential World.
- Epidemiology: What is Epidemiology?, A History of Epidemiology, Observational Research, Experimentation, Causation.
- Design: Sample Survey Design, Designing Experiments, General Considerations in Design.
- Correlation and Regression: History, Graphic Display of Paired Data: The Scatter Diagram, Prediction, Correlation Coefficient, Testing Independence, Cause-and-Effect versus Linear Relationship, Calculating a Correlation Coefficient and Determining the Prediction Line (Optional).
- Index Numbers: Definition, History and Construction of Index Numbers, The Consumer Price Index, Real or Constant Dollars, Other Index Numbers, Interpreting index Numbers.
- Doublespeak Revisited: Statistical Doublespeak, The Anatomy of Doublespeak.
Editorial comment: “Doublespeak” is not in Orwell's 1984, but it combines “Newspeak” and “Doubletalk.” For more on “Doublespeak,” see the NCTE Doublespeak Award.
OTHER ARTICLES by Dennis Haack:
1976: “ A Nonsymbolic Statistics Course” in Communications in Statistics, Methods and Techniques. Abstract: “A new statistics course is being taught at the University of Kentucky which does not require students to learn the symbolic language of statistics (the formulas). Students who will never take a traditional “methods” course in statistics learn to become better consumers of statistic fed them daily by the different news media. Other students who realize that much statistics await them in graduate school see this course as a good starting point.” Extract: “Testing in such a course is quite difficult but I have found that something other than the project is needed to evaluate students.”
1979:
“Teaching Statistical Literacy”
in Teaching Statistics, Vol. 1.3, pp 74-76.
Abstract: “More people
have to read and understand others’ statistics than have to carry out their
own statistical research. A first course in statistics should therefore
concentrate on statistics as a language.”
Extract: “A first course in statistics should teach statistics as a language rather than
as a research tool. Emphasis should be on interpreting statistics
rather than on calculating statistics.”
1980:
“A Note on Teaching Statistical Literacy”
in Teaching Statistics, Vol. 2.1, pp 22-23.
Abstract: “In his previous article Dennis Haack discussed the philosophy behind his
course in teaching statistics as a language. Here he looks at some ways of
assessing students taking such a course.”
Excerpt: “Grading students is always a problem—more so it seems with an interpretive approach
to teaching statistics. Three sources of information are being used in
arriving at a student’s grade in the course I am presently teaching.”
- “First, students are given weekly quizzes... Questions come from such local sources as the newspapers.” “What might have influenced these statistics besides the selection of a representative sample...?” “I don’t want students to simply list potential problem areas for any survey (as the source, the target population, wording of questions, timing, nonresponse rate, sample size and design, and method of contact) but to specify the areas of greatest concern for the specific example under consideration.” “Here I would prefer that students question how a ‘child’ is defined; in this example a child is anyone from age 2 to 20!”
- “Besides taking weekly quizzes, students also write (1/2-page) critiques of newspaper articles (5 per 15-week semester is sufficient). Again, one needs to look for some indication that the student can apply the principles discussed in class to the newspaper (or newsmagazine) example.”
- “The third and final component of a grade requires that a student ‘dig deeply’ into an application of statistics that the student has read or heard about. Students are encouraged to look for an example in their major field. For example, a project for a nursing student might involve critiquing an article in a medical journal. The purpose of this exercise is to get students to both look into a statistical application in their field of study and to go to an original source rather than feel they must always rely on the media’s interpretation of statistics.”
1980: “Statistical Doublespeak”
Quarterly Review of Doublespeak, Volume VII #1, October 1980.
Extract: “Statistical doublespeak is particularly effective since
statistical statements are not likely to be scrutinized.”
1981:
“Statistical Doublespeak II: Methods of Contact and Response Rates of Surveys”
Quarterly Review of Doublespeak, Vol. VII #2
January 1981.
Extract: “the key to successful polling, and hence to our evaluation of the results,
is that as many of the selected individuals as possible be interviewed.
The response rate, the percent of selected people actually interviewed,
is a key indicator of survey quality, yet it is a bit of information seldom divulged by a pollster.”
1981: “Statistical Doublespeak III: Survey Size and Timing”
Quarterly Review of Doublespeak, Vol. VII #3 April 1981.
Extracts:
“Our intuition regarding sample size can create problems if we are not
careful. First, size is not the most important aspect of a sample. How
potential respondents are selected is more important than size.”
“The timing of interviews is another important consideration in interpreting
survey results.”
“Timing is an issue because public opinion is
ever changing. Some changes arc predictable and can be taken into account as
we read the results of a survey.”
1981: “Statistical Doublespeak IV: Sample Design and Selection”
Quarterly Review of Doublespeak, Vol. VII #4 July 1981.
Extracts:
“If you have followed our discussions,
and thought about the different national surveys which are run, you should
have come to the conclusion that most national surveys are not very
accurate measures of public opinion.”
1981: “Teaching Statistical Literacy to Nurses” ASA Proceedings of the Section on Statistical Education, 101-102.

